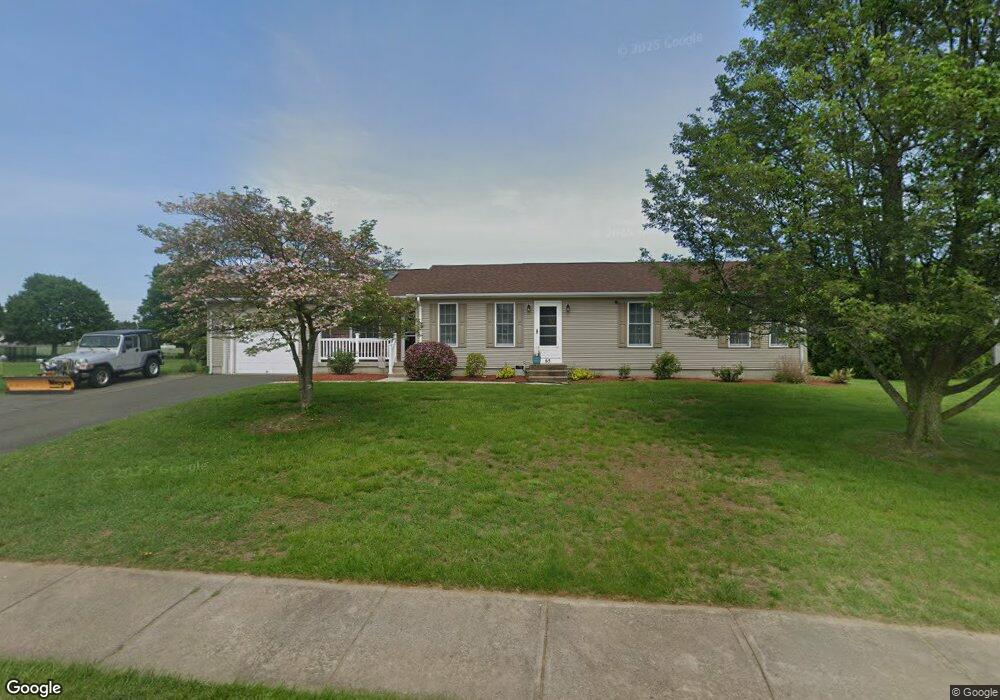
65 Rising St Feeding Hills, MA 01030
Estimated Value: $397,000 - $477,000
2
Beds
2
Baths
1,732
Sq Ft
$251/Sq Ft
Est. Value
About This Home
This home is located at 65 Rising St, Feeding Hills, MA 01030 and is currently estimated at $434,972, approximately $251 per square foot. 65 Rising St is a home located in Hampden County with nearby schools including Agawam Junior High School and Agawam High School.
Ownership History
Date
Name
Owned For
Owner Type
Purchase Details
Closed on
Jan 5, 2024
Sold by
Beard Anna L
Bought by
Crouss Ft and Crouss
Current Estimated Value
Purchase Details
Closed on
Nov 16, 1995
Sold by
Rose John R
Bought by
Crouss Anna L
Home Financials for this Owner
Home Financials are based on the most recent Mortgage that was taken out on this home.
Original Mortgage
$50,000
Interest Rate
7.53%
Mortgage Type
Purchase Money Mortgage
Purchase Details
Closed on
Sep 20, 1994
Sold by
Tourville David G and Tourville Jennifer A
Bought by
Rose John R
Purchase Details
Closed on
Oct 23, 1990
Sold by
Valley View Assocs Inc
Bought by
Tourville David G
Home Financials for this Owner
Home Financials are based on the most recent Mortgage that was taken out on this home.
Original Mortgage
$120,000
Interest Rate
10.14%
Mortgage Type
Purchase Money Mortgage
Create a Home Valuation Report for This Property
The Home Valuation Report is an in-depth analysis detailing your home's value as well as a comparison with similar homes in the area
Home Values in the Area
Average Home Value in this Area
Purchase History
| Date | Buyer | Sale Price | Title Company |
|---|---|---|---|
| Crouss Ft | -- | None Available | |
| Crouss Anna L | $137,292 | -- | |
| Rose John R | $121,000 | -- | |
| Tourville David G | $160,000 | -- |
Source: Public Records
Mortgage History
| Date | Status | Borrower | Loan Amount |
|---|---|---|---|
| Previous Owner | Tourville David G | $10,000 | |
| Previous Owner | Tourville David G | $50,000 | |
| Previous Owner | Tourville David G | $120,000 |
Source: Public Records
Tax History Compared to Growth
Tax History
| Year | Tax Paid | Tax Assessment Tax Assessment Total Assessment is a certain percentage of the fair market value that is determined by local assessors to be the total taxable value of land and additions on the property. | Land | Improvement |
|---|---|---|---|---|
| 2025 | $5,386 | $367,900 | $129,600 | $238,300 |
| 2024 | $5,256 | $361,500 | $129,600 | $231,900 |
| 2023 | $5,461 | $346,100 | $116,900 | $229,200 |
| 2022 | $5,239 | $325,200 | $116,900 | $208,300 |
| 2021 | $4,795 | $285,400 | $99,600 | $185,800 |
| 2020 | $4,696 | $279,000 | $97,600 | $181,400 |
| 2019 | $4,555 | $273,600 | $94,800 | $178,800 |
| 2018 | $4,393 | $264,500 | $94,800 | $169,700 |
| 2017 | $4,174 | $255,900 | $94,800 | $161,100 |
| 2016 | $4,084 | $252,400 | $94,800 | $157,600 |
| 2015 | $3,894 | $247,400 | $94,800 | $152,600 |
Source: Public Records
Map
Nearby Homes
- 36-38 Orlando St
- 157 Cambridge St
- 4 Liquori Dr
- 511 Shoemaker Ln
- 94 Witheridge St
- 441 Silver St
- 200 Anvil St
- 108 Franklin St
- 60 Elizabeth St
- 92 Juniper Ridge Dr
- lot A North St
- 999 N Street Extension
- 712 Cooper St
- 106 Cherry St
- 73 Silver Lake Dr
- 387 Southwick St
- 190 Mill St
- 1085 N Street Extension
- 66 Sheri Ln Unit 66
- 50 Muriel Ln