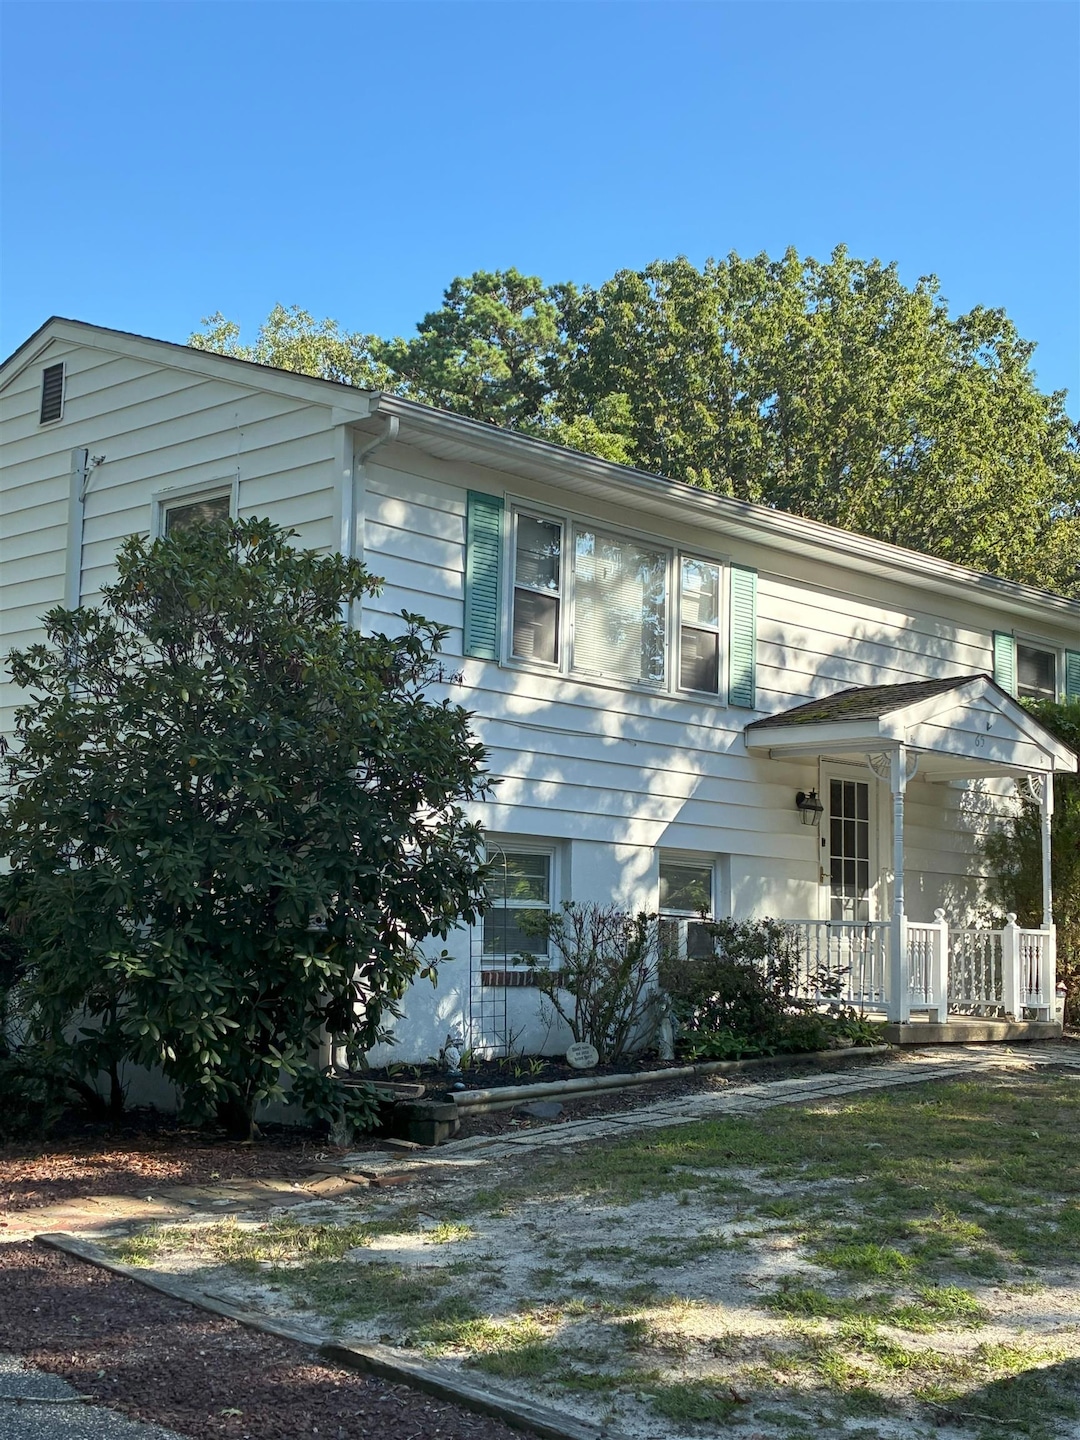

65 Route 50 Ocean View, NJ 08230
Highlights
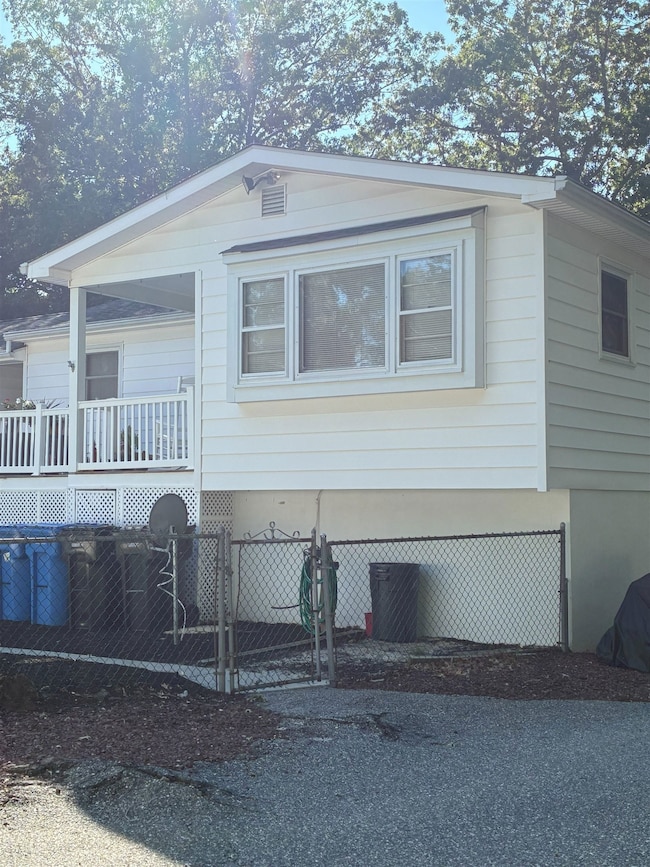
- Deck
- Living Room
- Forced Air Heating and Cooling System
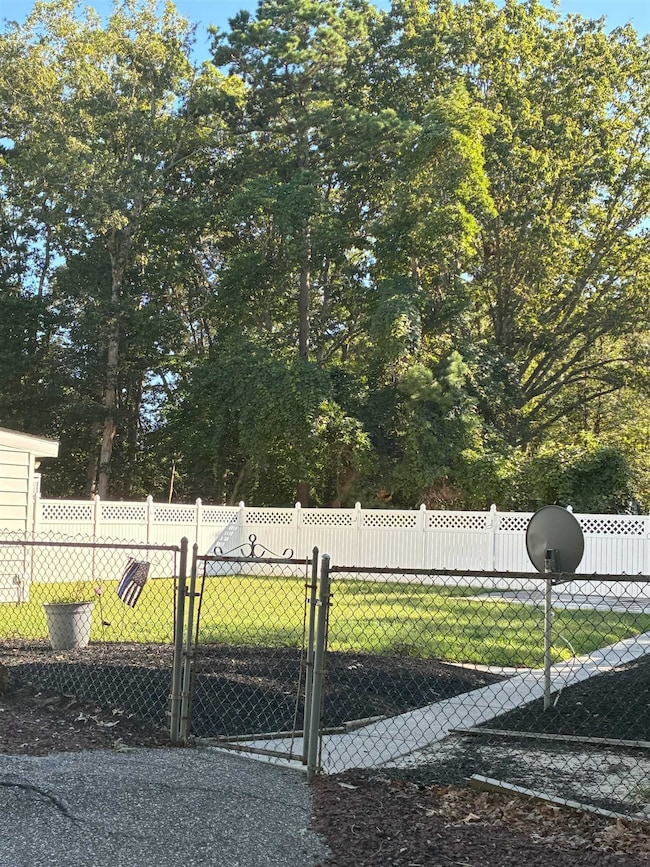
- Fenced Yard
- Outdoor Storage
About This Home
Single family Split level home for Rent Starting February 1st. 3 bdrm. 2 full baths. with a dining area/tv room next to kitchen. Owner requires 1 1/2 months security deposit. $75.00 credit check per applicant. Nice size yard and back porch. new Washer/dryer, dehumidifier and dishwasher. No smoking and No pets.
Home Details
Home Type
- Single Family
Est. Annual Taxes
- $5,616
Year Built
- Built in 1980
Lot Details
- Lot Dimensions are 105x250
- Fenced Yard
Home Design
- Bi-Level Home
- Vinyl Siding
Interior Spaces
- Blinds
- Living Room
Kitchen
- Oven
- Microwave
- Dishwasher
Bedrooms and Bathrooms
- 3 Bedrooms
- 2 Full Bathrooms
Laundry
- Dryer
- Washer
Parking
- 2 Car Garage
- Parking Pad
- Driveway
- Assigned Parking
Outdoor Features
- Deck
- Outdoor Storage
Utilities
- Forced Air Heating and Cooling System
- Electric Water Heater
Community Details
- No Pets Allowed
Listing and Financial Details
- Rent includes trash removal, taxes
- Legal Lot and Block 31 / 561
Map
Source: Cape May County Association of REALTORS®
MLS Number: 252466
APN: 11-00561-0000-00031
Disclaimer: Certain information contained herein is derived from information provided by parties other than Homes.com. All information provided is deemed reliable, but is not guaranteed to be accurate and should be independently verified.
![]() Broker Reciprocity: The data relating to real estate for sale or rent on this web site comes in part from the Broker Reciprocity program of the Cape May County Multiple Listing Service. Real estate listings held by brokerage firms other than Ten-X are marked with the Broker Reciprocity logo or the Broker Reciprocity thumbnail logo and detailed information about them includes the name of the listing brokers. This information is deemed reliable but not guaranteed. Representations as subject to verification by inspection and subject to change without notice. Some properties which appear for sale or rent on this website may no longer be available because they are under contract, have sold, or are no longer being offered for sale or rent. Information is deemed to be accurate but not guaranteed.
Broker Reciprocity: The data relating to real estate for sale or rent on this web site comes in part from the Broker Reciprocity program of the Cape May County Multiple Listing Service. Real estate listings held by brokerage firms other than Ten-X are marked with the Broker Reciprocity logo or the Broker Reciprocity thumbnail logo and detailed information about them includes the name of the listing brokers. This information is deemed reliable but not guaranteed. Representations as subject to verification by inspection and subject to change without notice. Some properties which appear for sale or rent on this website may no longer be available because they are under contract, have sold, or are no longer being offered for sale or rent. Information is deemed to be accurate but not guaranteed.
- 11 Scott Ln
- 109 Brigantine Dr
- 404 50th St
- 823 Periwinkle Dr Unit 823
- 15 36th St Unit 15
- 3136-38 Haven Ave Unit ID1309026P
- 220 86th St Unit 1st Floor
- 102 Harbor Rd
- 8 Dolphin Ct
- 1910 Central Ave
- 1527 Bay Ave Unit B
- 1301 Haven Ave
- 1301 West Ave
- 17 E 12th St Unit 17
- 1142 Simpson Ave Unit ID1308992P
- 1140 Simpson Ave Unit ID1309006P
- 1140 Simpson Ave Unit ID1309005P
- 1102 Wesley Ave Unit B
