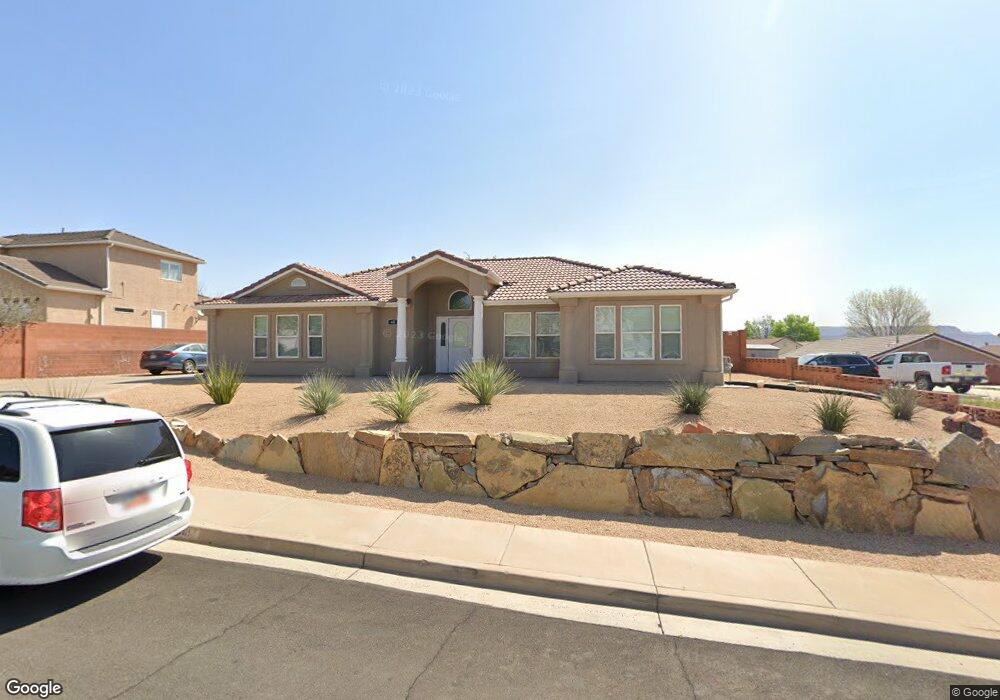
65 S 2110 E St. George, UT 84790
Estimated Value: $444,000 - $509,000
3
Beds
2
Baths
1,866
Sq Ft
$258/Sq Ft
Est. Value
About This Home
This home is located at 65 S 2110 E, St. George, UT 84790 and is currently estimated at $481,144, approximately $257 per square foot. 65 S 2110 E is a home located in Washington County with nearby schools including Panorama School, Fossil Ridge Intermediate School, and Pine View Middle School.
Ownership History
Date
Name
Owned For
Owner Type
Purchase Details
Closed on
Jun 21, 2019
Sold by
Leon Lisa
Bought by
Hatch Elwood Gregory and Hatch Rachel Day
Current Estimated Value
Purchase Details
Closed on
Dec 6, 2018
Sold by
Lewis Georgianna M
Bought by
Lewis Georgianna M and William & Georgianna Lewis Trust
Purchase Details
Closed on
Aug 7, 2017
Sold by
Burris Judy
Bought by
Jlewis Gerogeianna M
Home Financials for this Owner
Home Financials are based on the most recent Mortgage that was taken out on this home.
Original Mortgage
$403,500
Interest Rate
3.9%
Mortgage Type
Reverse Mortgage Home Equity Conversion Mortgage
Purchase Details
Closed on
Sep 28, 2009
Sold by
Nelson Lynn A and Nelson Lois E
Bought by
Burris Judy
Home Financials for this Owner
Home Financials are based on the most recent Mortgage that was taken out on this home.
Original Mortgage
$196,377
Interest Rate
5.08%
Mortgage Type
FHA
Create a Home Valuation Report for This Property
The Home Valuation Report is an in-depth analysis detailing your home's value as well as a comparison with similar homes in the area
Purchase History
| Date | Buyer | Sale Price | Title Company |
|---|---|---|---|
| Hatch Elwood Gregory | -- | Terra Title Company | |
| Lewis Georgianna M | -- | None Available3 | |
| Jlewis Gerogeianna M | -- | Infinity Title Ins Agency Ll | |
| Burris Judy | -- | United Title Services |
Source: Public Records
Mortgage History
| Date | Status | Borrower | Loan Amount |
|---|---|---|---|
| Previous Owner | Jlewis Gerogeianna M | $403,500 | |
| Previous Owner | Burris Judy | $196,377 |
Source: Public Records
Tax History
| Year | Tax Paid | Tax Assessment Tax Assessment Total Assessment is a certain percentage of the fair market value that is determined by local assessors to be the total taxable value of land and additions on the property. | Land | Improvement |
|---|---|---|---|---|
| 2025 | $1,707 | $250,525 | $59,400 | $191,125 |
| 2023 | $1,778 | $265,650 | $52,800 | $212,850 |
| 2022 | $1,890 | $265,540 | $52,250 | $213,290 |
| 2021 | $1,687 | $353,500 | $80,000 | $273,500 |
| 2020 | $1,527 | $301,300 | $60,000 | $241,300 |
| 2019 | $1,487 | $286,600 | $60,000 | $226,600 |
| 2018 | $1,446 | $139,755 | $0 | $0 |
| 2017 | $1,378 | $133,155 | $0 | $0 |
| 2016 | $1,439 | $128,590 | $0 | $0 |
| 2015 | $1,396 | $119,680 | $0 | $0 |
| 2014 | $1,279 | $110,330 | $0 | $0 |
Source: Public Records
Map
Nearby Homes
- 77 S 2000 E
- 4204 S Crimson Cir Unit 10
- 4186 S Crimson Cir Unit 13
- 1932 E 40 South Cir
- 201 S 2020 East Cir
- 210 N Mall Dr Unit 115
- 210 N Mall Dr Unit 27
- 5664 S Carnelian Pkwy
- 2294 E 170 N
- 145 N Mall Dr Unit 57
- 232 S Acantilado Cir
- 86 S Acantilado Dr
- 24 S Arroyo Dr
- 345 N 2450 E Unit 152
- 345 N 2450 E Unit 220
- 345 N 2450 E Unit 130
- 345 N 2450 E Unit 220
- 345 N 2450 E Unit 117
- 345 N 2450 E Unit 234
- 345 N 2450 E Unit 152
- 65 S 2110 East Cir
- 51 S 2110 East Cir
- 83 S 2110 East Cir
- 66 S 2110 E
- 2142 E 50 South Cir
- 66 S 2110 East Cir
- 2142 E 50 Cir S
- 83 S 2110 E
- 2129 E 100 S
- 78 S 2110 E
- 78 S 2110 East Cir
- 54 S 2110 E
- 54 S 2110 East Cir
- 2148 E 50 South Cir
- 37 S 2110 East Cir
- 2148 E 50 Cir S
- 2145 E 50 South Cir
- 40 S 2110 E
- 40 S 2110 East Cir
- 2141 E 100 S
Your Personal Tour Guide
Ask me questions while you tour the home.