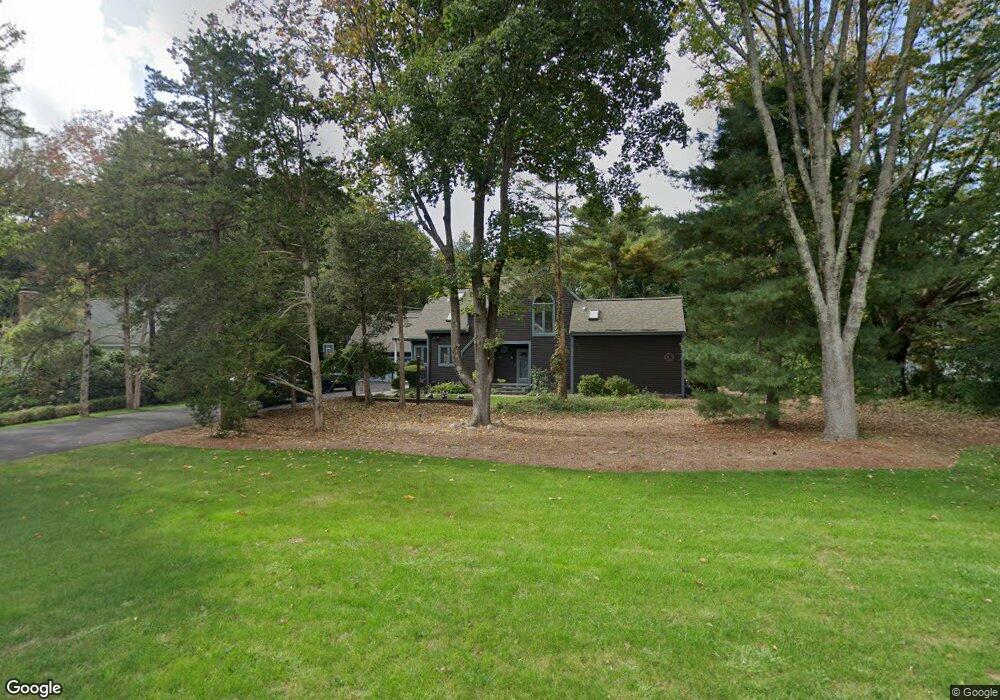
65 S Walnut St Mansfield, MA 02048
Estimated Value: $640,000 - $1,002,000
3
Beds
3
Baths
2,800
Sq Ft
$271/Sq Ft
Est. Value
About This Home
This home is located at 65 S Walnut St, Mansfield, MA 02048 and is currently estimated at $759,993, approximately $271 per square foot. 65 S Walnut St is a home located in Bristol County with nearby schools including Everett W. Robinson Elementary School, Jordan/Jackson Elementary School, and Harold L. Qualters Middle School.
Ownership History
Date
Name
Owned For
Owner Type
Purchase Details
Closed on
Jul 14, 2022
Sold by
Dion David J and Dion Nancy E
Bought by
David J Dion Ret 2022
Current Estimated Value
Purchase Details
Closed on
Aug 22, 2003
Sold by
Frongillo Thomas C and Frongillo Margarita
Bought by
Dion David J and Dion Nancy E
Home Financials for this Owner
Home Financials are based on the most recent Mortgage that was taken out on this home.
Original Mortgage
$335,000
Interest Rate
5.52%
Mortgage Type
Purchase Money Mortgage
Create a Home Valuation Report for This Property
The Home Valuation Report is an in-depth analysis detailing your home's value as well as a comparison with similar homes in the area
Home Values in the Area
Average Home Value in this Area
Purchase History
| Date | Buyer | Sale Price | Title Company |
|---|---|---|---|
| David J Dion Ret 2022 | -- | None Available | |
| Dion David J | $495,000 | -- |
Source: Public Records
Mortgage History
| Date | Status | Borrower | Loan Amount |
|---|---|---|---|
| Previous Owner | Dion David J | $335,000 |
Source: Public Records
Tax History
| Year | Tax Paid | Tax Assessment Tax Assessment Total Assessment is a certain percentage of the fair market value that is determined by local assessors to be the total taxable value of land and additions on the property. | Land | Improvement |
|---|---|---|---|---|
| 2025 | $6,945 | $527,300 | $245,500 | $281,800 |
| 2024 | $7,066 | $523,400 | $245,500 | $277,900 |
| 2023 | $6,808 | $483,200 | $245,500 | $237,700 |
| 2022 | $6,582 | $433,900 | $227,300 | $206,600 |
| 2021 | $6,556 | $426,800 | $198,900 | $227,900 |
| 2020 | $6,235 | $405,900 | $189,400 | $216,500 |
| 2019 | $6,044 | $397,100 | $157,800 | $239,300 |
| 2018 | $5,771 | $385,200 | $150,500 | $234,700 |
| 2017 | $5,723 | $381,000 | $146,300 | $234,700 |
| 2016 | $5,626 | $365,100 | $139,200 | $225,900 |
| 2015 | $5,659 | $365,100 | $139,200 | $225,900 |
Source: Public Records
Map
Nearby Homes
Your Personal Tour Guide
Ask me questions while you tour the home.