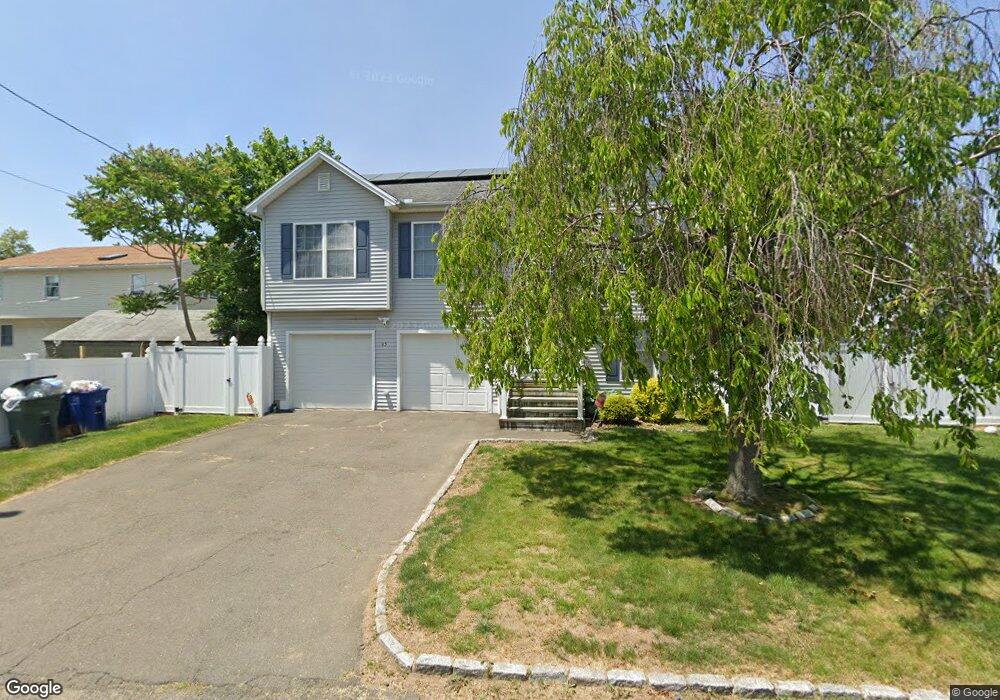
65 Scott St Bridgeport, CT 06606
Reservoir-Whiskey Hill NeighborhoodEstimated Value: $408,000 - $536,000
4
Beds
3
Baths
1,532
Sq Ft
$313/Sq Ft
Est. Value
About This Home
This home is located at 65 Scott St, Bridgeport, CT 06606 and is currently estimated at $480,267, approximately $313 per square foot. 65 Scott St is a home located in Fairfield County with nearby schools including Hallen School, Central High School, and Northeastern Adventist Academy - Fairfield County.
Ownership History
Date
Name
Owned For
Owner Type
Purchase Details
Closed on
Dec 6, 2011
Sold by
Hsbc Bank Usa Na
Bought by
Roberts Kirkland
Current Estimated Value
Home Financials for this Owner
Home Financials are based on the most recent Mortgage that was taken out on this home.
Original Mortgage
$204,676
Outstanding Balance
$143,902
Interest Rate
4.1%
Estimated Equity
$336,365
Purchase Details
Closed on
Dec 16, 2005
Sold by
Broad Bridge Hill Dev
Bought by
Marshall Charles and Marshall Beth
Home Financials for this Owner
Home Financials are based on the most recent Mortgage that was taken out on this home.
Original Mortgage
$289,468
Interest Rate
8.8%
Purchase Details
Closed on
Sep 2, 2003
Sold by
Tacovicco Dominic R
Bought by
Broadbridge Hill Devel
Create a Home Valuation Report for This Property
The Home Valuation Report is an in-depth analysis detailing your home's value as well as a comparison with similar homes in the area
Home Values in the Area
Average Home Value in this Area
Purchase History
| Date | Buyer | Sale Price | Title Company |
|---|---|---|---|
| Roberts Kirkland | $210,000 | -- | |
| Roberts Kirkland | $210,000 | -- | |
| Marshall Charles | $321,632 | -- | |
| Marshall Charles | $321,632 | -- | |
| Broadbridge Hill Devel | $100,000 | -- |
Source: Public Records
Mortgage History
| Date | Status | Borrower | Loan Amount |
|---|---|---|---|
| Open | Broadbridge Hill Devel | $204,676 | |
| Closed | Broadbridge Hill Devel | $204,676 | |
| Previous Owner | Broadbridge Hill Devel | $289,468 |
Source: Public Records
Tax History
| Year | Tax Paid | Tax Assessment Tax Assessment Total Assessment is a certain percentage of the fair market value that is determined by local assessors to be the total taxable value of land and additions on the property. | Land | Improvement |
|---|---|---|---|---|
| 2025 | $9,391 | $216,140 | $66,230 | $149,910 |
| 2024 | $9,391 | $216,140 | $66,230 | $149,910 |
| 2023 | $9,391 | $216,140 | $66,230 | $149,910 |
| 2022 | $9,391 | $216,140 | $66,230 | $149,910 |
| 2021 | $9,391 | $216,140 | $66,230 | $149,910 |
| 2020 | $9,177 | $169,970 | $38,120 | $131,850 |
| 2019 | $9,177 | $169,970 | $38,120 | $131,850 |
| 2018 | $9,241 | $169,970 | $38,120 | $131,850 |
| 2017 | $9,241 | $169,970 | $38,120 | $131,850 |
| 2016 | $9,241 | $169,970 | $38,120 | $131,850 |
| 2015 | $8,865 | $210,060 | $43,720 | $166,340 |
| 2014 | $8,865 | $210,060 | $43,720 | $166,340 |
Source: Public Records
Map
Nearby Homes
- 940 Reservoir Ave
- 110 Wilkins Ave
- 28 Wilkins Ave
- 769 Sylvan Ave Unit 13
- 717 Reservoir Ave
- 705 Reservoir Ave
- 45 Polk St
- 360 Saunders Ave
- 438 Soundview Ave
- 474 Indian Ave
- 125 Robert St
- 153 Marigold Ave
- 410 Alba Ave
- 403 Indian Ave
- 74 Hollywood Ave
- 156 Dayton Rd
- 274 Platt St
- 181 Cityview Ave
- 82 Yaremich Dr
- 165 Yaremich Dr
- 186 Edwards St
- 192 Edwards St
- 984 Reservoir Ave
- 87 Rita Ave
- 77 Rita Ave
- 970 Reservoir Ave
- 67 Rita Ave
- 1006 Reservoir Ave
- 200 Edwards St
- 72 Scott St
- 156 Edwards St
- 167 Edwards St
- 138 Edwards St
- 151 Edwards St
- 49 Rita Ave
- 1026 Reservoir Ave
- 1015 Reservoir Ave
- 136 Edwards St
- 41 Rita Ave
- 975 Reservoir Ave
Your Personal Tour Guide
Ask me questions while you tour the home.