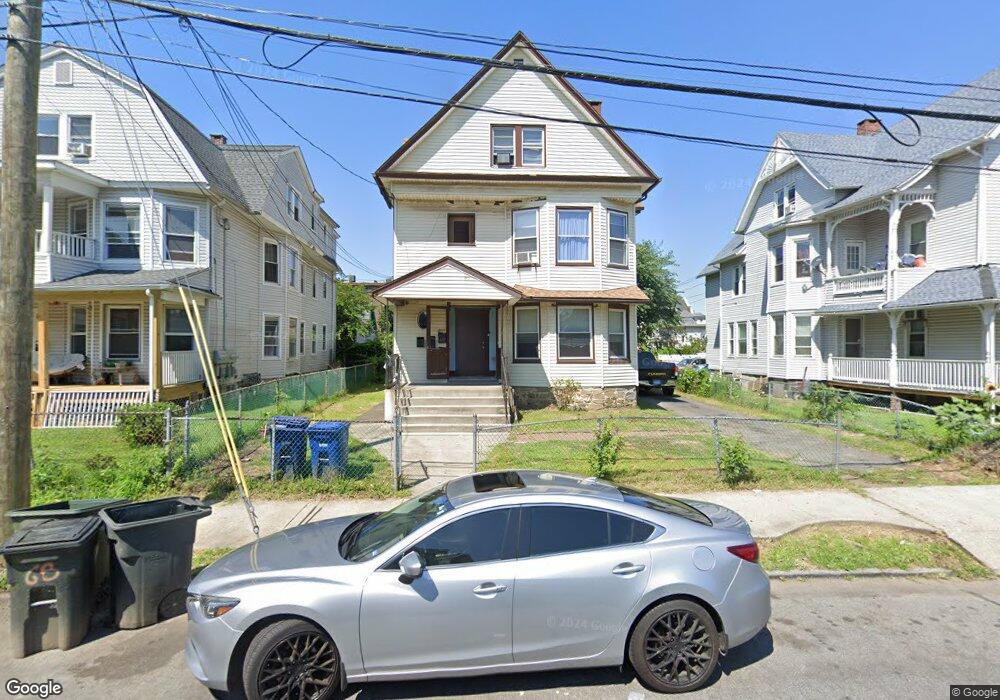
65 Sherwood Ave Unit 1 Bridgeport, CT 06605
West End-West Side NeighborhoodEstimated Value: $567,392 - $766,000
2
Beds
1
Bath
1,200
Sq Ft
$539/Sq Ft
Est. Value
About This Home
This home is located at 65 Sherwood Ave Unit 1, Bridgeport, CT 06605 and is currently estimated at $646,848, approximately $539 per square foot. 65 Sherwood Ave Unit 1 is a home located in Fairfield County with nearby schools including James J. Curiale School, Bassick High School, and New Beginnings Family Academy.
Ownership History
Date
Name
Owned For
Owner Type
Purchase Details
Closed on
Nov 22, 2019
Sold by
Kashem Abul
Bought by
Toro Michael
Current Estimated Value
Purchase Details
Closed on
Jun 23, 2014
Sold by
Frattarola Emilio
Bought by
Kashem Abul
Home Financials for this Owner
Home Financials are based on the most recent Mortgage that was taken out on this home.
Original Mortgage
$179,685
Interest Rate
4.21%
Mortgage Type
New Conventional
Purchase Details
Closed on
Aug 18, 2008
Sold by
Bank Of New York
Bought by
Frattarola Emilio and Frattarola Christopher B
Purchase Details
Closed on
Jun 25, 2002
Sold by
Gonzalez Ana M
Bought by
Pineda Jose
Purchase Details
Closed on
Oct 3, 1997
Sold by
Cullen Cecelia and Cullen Thomas
Bought by
Torres Ana
Create a Home Valuation Report for This Property
The Home Valuation Report is an in-depth analysis detailing your home's value as well as a comparison with similar homes in the area
Home Values in the Area
Average Home Value in this Area
Purchase History
| Date | Buyer | Sale Price | Title Company |
|---|---|---|---|
| Toro Michael | $340,000 | -- | |
| Toro Michael | $340,000 | -- | |
| Kashem Abul | $183,000 | -- | |
| Kashem Abul | $183,000 | -- | |
| Frattarola Emilio | $178,000 | -- | |
| Frattarola Emilio | $178,000 | -- | |
| Pineda Jose | $204,900 | -- | |
| Torres Ana | $93,350 | -- | |
| Torres Ana | $93,350 | -- |
Source: Public Records
Mortgage History
| Date | Status | Borrower | Loan Amount |
|---|---|---|---|
| Previous Owner | Torres Ana | $179,685 |
Source: Public Records
Tax History Compared to Growth
Tax History
| Year | Tax Paid | Tax Assessment Tax Assessment Total Assessment is a certain percentage of the fair market value that is determined by local assessors to be the total taxable value of land and additions on the property. | Land | Improvement |
|---|---|---|---|---|
| 2025 | $9,528 | $219,280 | $51,940 | $167,340 |
| 2024 | $9,528 | $219,280 | $51,940 | $167,340 |
| 2023 | $9,528 | $219,280 | $51,940 | $167,340 |
| 2022 | $9,528 | $219,280 | $51,940 | $167,340 |
| 2021 | $9,528 | $219,280 | $51,940 | $167,340 |
| 2020 | $7,140 | $132,240 | $31,470 | $100,770 |
| 2019 | $7,140 | $132,240 | $31,470 | $100,770 |
| 2018 | $7,190 | $132,240 | $31,470 | $100,770 |
| 2017 | $7,190 | $132,240 | $31,470 | $100,770 |
| 2016 | $7,190 | $132,240 | $31,470 | $100,770 |
| 2015 | $7,873 | $186,560 | $47,600 | $138,960 |
| 2014 | $7,873 | $186,560 | $47,600 | $138,960 |
Source: Public Records
Map
Nearby Homes
- 393 Laurel Ave Unit 203
- 393 Laurel Ave Unit 415
- 357 Norman St
- 592 Norman St Unit 594
- 60 Olive St
- 533 Clinton Ave
- 1199 Iranistan Ave Unit 1201
- 414 Wood Ave
- 468 Colorado Ave
- 1373 Iranistan Ave
- 700 Laurel Ave
- 697 Laurel Ave
- 670 Clinton Ave
- 826 Norman St
- 865 Iranistan Ave
- 150 Clinton Ave
- 99 Denver Ave Unit 101
- 115 Denver Ave Unit 117
- 90 Lee Ave
- 212 Denver Ave
- 65 Sherwood Ave
- 73 Sherwood Ave
- 59 Sherwood Ave
- 373 Laurel Ave
- 35 Sherwood Ave
- 323 Laurel Ave
- 33 Sherwood Ave
- 58 Sherwood Ave Unit 60
- 321 Laurel Ave
- 95 Sherwood Ave Unit 97
- 370 Laurel Ave Unit 372
- 44 Sherwood Ave
- 47 Sherwood Ave
- 393 Laurel Ave Unit 414
- 393 Laurel Ave Unit 413
- 393 Laurel Ave Unit 412
- 393 Laurel Ave Unit 411
- 393 Laurel Ave Unit 410
- 393 Laurel Ave Unit 408