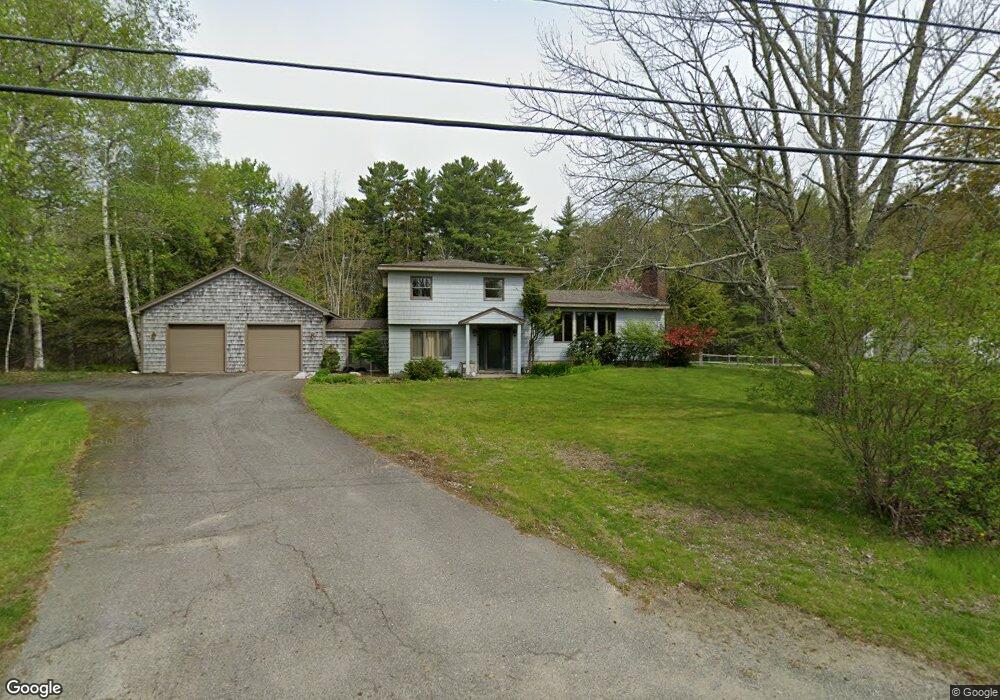
65 Simonton Rd Camden, ME 04843
Estimated Value: $473,000 - $596,000
2
Beds
2
Baths
2,111
Sq Ft
$248/Sq Ft
Est. Value
About This Home
This home is located at 65 Simonton Rd, Camden, ME 04843 and is currently estimated at $524,526, approximately $248 per square foot. 65 Simonton Rd is a home located in Knox County with nearby schools including Camden-Rockport Elementary School, Camden-Rockport Middle School, and Camden Hills Regional High School.
Ownership History
Date
Name
Owned For
Owner Type
Purchase Details
Closed on
Sep 11, 2014
Sold by
Willfong Peggy
Bought by
Weeks Edward and Weeks Susan
Current Estimated Value
Home Financials for this Owner
Home Financials are based on the most recent Mortgage that was taken out on this home.
Original Mortgage
$180,000
Outstanding Balance
$137,700
Interest Rate
4.12%
Mortgage Type
New Conventional
Estimated Equity
$386,826
Purchase Details
Closed on
Jan 22, 2014
Sold by
Chiles Pamela S and Chiles David L
Bought by
Willfong Peggy
Purchase Details
Closed on
Feb 16, 2006
Sold by
Maddox Juanita A and Maddox Robert S
Bought by
Chiles Carolyn R
Create a Home Valuation Report for This Property
The Home Valuation Report is an in-depth analysis detailing your home's value as well as a comparison with similar homes in the area
Home Values in the Area
Average Home Value in this Area
Purchase History
| Date | Buyer | Sale Price | Title Company |
|---|---|---|---|
| Weeks Edward | -- | -- | |
| Willfong Peggy | -- | -- | |
| Chiles Carolyn R | -- | -- |
Source: Public Records
Mortgage History
| Date | Status | Borrower | Loan Amount |
|---|---|---|---|
| Open | Weeks Edward | $180,000 |
Source: Public Records
Tax History Compared to Growth
Tax History
| Year | Tax Paid | Tax Assessment Tax Assessment Total Assessment is a certain percentage of the fair market value that is determined by local assessors to be the total taxable value of land and additions on the property. | Land | Improvement |
|---|---|---|---|---|
| 2024 | $4,734 | $450,900 | $159,000 | $291,900 |
| 2023 | $4,154 | $301,000 | $63,900 | $237,100 |
| 2022 | $3,973 | $301,000 | $63,900 | $237,100 |
| 2021 | $3,503 | $228,200 | $68,200 | $160,000 |
| 2020 | $3,430 | $228,200 | $68,200 | $160,000 |
| 2019 | $3,402 | $228,200 | $68,200 | $160,000 |
| 2018 | $3,342 | $224,600 | $64,600 | $160,000 |
| 2017 | $3,230 | $224,600 | $64,600 | $160,000 |
| 2016 | $3,866 | $248,000 | $63,200 | $184,800 |
| 2015 | $3,752 | $248,000 | $63,200 | $184,800 |
| 2014 | $3,579 | $248,000 | $63,200 | $184,800 |
| 2013 | $3,482 | $248,000 | $63,200 | $184,800 |
Source: Public Records
Map
Nearby Homes