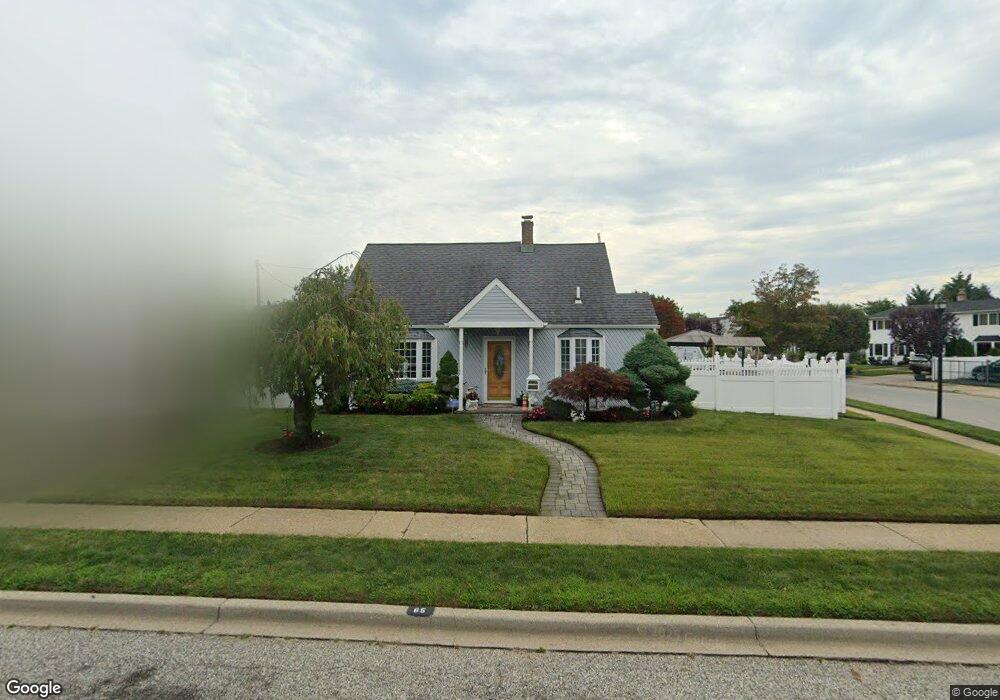
65 Spring Ln Levittown, NY 11756
Estimated Value: $636,900 - $640,000
Studio
1
Bath
1,176
Sq Ft
$543/Sq Ft
Est. Value
About This Home
This home is located at 65 Spring Ln, Levittown, NY 11756 and is currently estimated at $638,450, approximately $542 per square foot. 65 Spring Ln is a home located in Nassau County with nearby schools including Gardiners Avenue School, Jonas E. Salk Middle School, and Gen. Douglas MacArthur Senior High School.
Ownership History
Date
Name
Owned For
Owner Type
Purchase Details
Closed on
Nov 3, 2014
Sold by
Marinacci Charlene Teresa and Marinacci Louis
Bought by
Marinacci Louis
Current Estimated Value
Purchase Details
Closed on
Jun 19, 1998
Sold by
Mercado Luis A and Mercado Carmen M
Bought by
Marinacci Louis L and Marinacci Teresa C
Purchase Details
Closed on
Sep 28, 1995
Sold by
Fogerty James and Fogerty Beth
Bought by
Mercado Luis and Mercado Carmen
Home Financials for this Owner
Home Financials are based on the most recent Mortgage that was taken out on this home.
Original Mortgage
$136,000
Interest Rate
7.86%
Create a Home Valuation Report for This Property
The Home Valuation Report is an in-depth analysis detailing your home's value as well as a comparison with similar homes in the area
Home Values in the Area
Average Home Value in this Area
Purchase History
| Date | Buyer | Sale Price | Title Company |
|---|---|---|---|
| Marinacci Louis | -- | Fidelity National Title | |
| Marinacci Louis L | $152,000 | -- | |
| Mercado Luis | $136,000 | -- |
Source: Public Records
Mortgage History
| Date | Status | Borrower | Loan Amount |
|---|---|---|---|
| Previous Owner | Mercado Luis | $136,000 |
Source: Public Records
Tax History
| Year | Tax Paid | Tax Assessment Tax Assessment Total Assessment is a certain percentage of the fair market value that is determined by local assessors to be the total taxable value of land and additions on the property. | Land | Improvement |
|---|---|---|---|---|
| 2025 | $10,709 | $363 | $200 | $163 |
| 2024 | $2,964 | $373 | $206 | $167 |
| 2023 | $9,494 | $381 | $210 | $171 |
| 2022 | $9,494 | $381 | $210 | $171 |
| 2021 | $12,160 | $373 | $206 | $167 |
| 2020 | $8,661 | $443 | $442 | $1 |
| 2019 | $7,707 | $475 | $474 | $1 |
| 2018 | $7,908 | $507 | $0 | $0 |
| 2017 | $5,462 | $538 | $432 | $106 |
| 2016 | $8,191 | $657 | $527 | $130 |
| 2015 | -- | $657 | $527 | $130 |
| 2014 | -- | $657 | $527 | $130 |
| 2013 | $3,211 | $657 | $527 | $130 |
Source: Public Records
Map
Nearby Homes
Your Personal Tour Guide
Ask me questions while you tour the home.