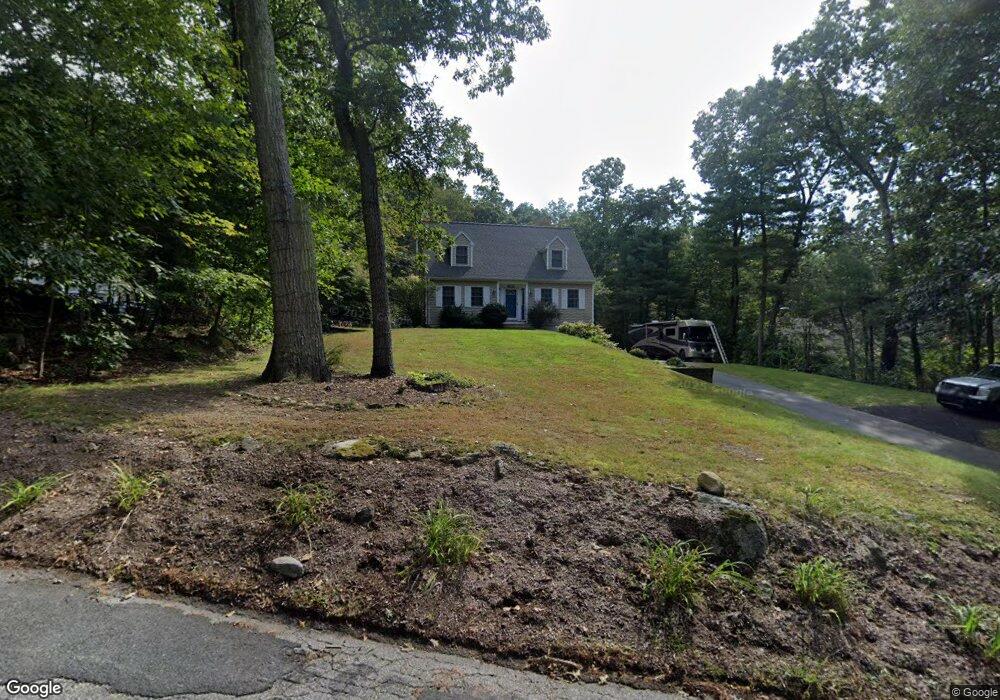
65 St John St Palmer, MA 01069
Estimated Value: $430,000 - $467,000
3
Beds
2
Baths
2,000
Sq Ft
$225/Sq Ft
Est. Value
About This Home
This home is located at 65 St John St, Palmer, MA 01069 and is currently estimated at $449,386, approximately $224 per square foot. 65 St John St is a home located in Hampden County with nearby schools including Old Mill Pond Elementary School, Converse Middle School, and Palmer High School.
Ownership History
Date
Name
Owned For
Owner Type
Purchase Details
Closed on
Mar 29, 2011
Sold by
Miele Kristine A
Bought by
Miele Kristine A and Camachao Dario
Current Estimated Value
Home Financials for this Owner
Home Financials are based on the most recent Mortgage that was taken out on this home.
Original Mortgage
$192,000
Outstanding Balance
$130,774
Interest Rate
5.07%
Mortgage Type
Purchase Money Mortgage
Estimated Equity
$318,612
Purchase Details
Closed on
May 23, 2006
Sold by
Putnam Haldimand S and Greta Putnam A
Bought by
Mcavoy Jeffrey G and Mcavoy Dana L
Home Financials for this Owner
Home Financials are based on the most recent Mortgage that was taken out on this home.
Original Mortgage
$218,000
Interest Rate
6.42%
Mortgage Type
Purchase Money Mortgage
Purchase Details
Closed on
Dec 7, 1993
Sold by
Messier Michael J and Messier Claudia J
Bought by
Holden Joseph J and Greta Holden A
Create a Home Valuation Report for This Property
The Home Valuation Report is an in-depth analysis detailing your home's value as well as a comparison with similar homes in the area
Home Values in the Area
Average Home Value in this Area
Purchase History
| Date | Buyer | Sale Price | Title Company |
|---|---|---|---|
| Miele Kristine A | -- | -- | |
| Miele Kristine A | $240,000 | -- | |
| Mcavoy Jeffrey G | $272,500 | -- | |
| Holden Joseph J | $34,200 | -- | |
| Miele Kristine A | -- | -- | |
| Mcavoy Jeffrey G | $272,500 | -- |
Source: Public Records
Mortgage History
| Date | Status | Borrower | Loan Amount |
|---|---|---|---|
| Open | Miele Kristine A | $192,000 | |
| Closed | Holden Joseph J | $0 | |
| Previous Owner | Mcavoy Jeffrey G | $218,000 | |
| Previous Owner | Mcavoy Jeffrey G | $27,250 |
Source: Public Records
Tax History
| Year | Tax Paid | Tax Assessment Tax Assessment Total Assessment is a certain percentage of the fair market value that is determined by local assessors to be the total taxable value of land and additions on the property. | Land | Improvement |
|---|---|---|---|---|
| 2025 | $7,248 | $396,500 | $70,800 | $325,700 |
| 2024 | $6,716 | $359,700 | $64,200 | $295,500 |
| 2023 | $6,479 | $333,300 | $64,200 | $269,100 |
| 2022 | $6,157 | $287,700 | $56,300 | $231,400 |
| 2021 | $5,759 | $254,500 | $62,500 | $192,000 |
| 2020 | $5,556 | $243,700 | $62,500 | $181,200 |
| 2019 | $5,396 | $243,700 | $62,500 | $181,200 |
| 2018 | $5,273 | $238,800 | $60,800 | $178,000 |
| 2017 | $5,151 | $238,800 | $60,800 | $178,000 |
| 2016 | $4,971 | $233,700 | $59,000 | $174,700 |
| 2015 | $4,821 | $233,700 | $59,000 | $174,700 |
Source: Public Records
Map
Nearby Homes
- 593 Old Warren Rd
- 599-607 Old Warren Rd
- 123 Peterson Rd
- 1711-1723 Ware St
- Lot 34 Old Warren Rd
- 61 Beech St
- 50 Stimson St
- 248 Ware St
- 0 Old Warren Rd
- 101 Ware St
- 213 River St
- Lot 14 Center St
- 4498 High St
- 141 Thompson St
- 4415 High St
- 19 Chapel St
- 47 North St
- 70 Summer St
- Lot 8 Breckenridge St
- 264 Flynt St
- 65 Saint John St
- 47 Saint John St
- 57 Saint John St
- 57 St John St
- 73 Saint John St
- 45 Saint John St
- 45 St John St
- 76 Saint John St
- 76 Saint John St
- 58 Saint John St
- 77 Saint John St
- 39 Saint John St
- 60 Saint John St
- 84 Saint John St
- 79 Saint John St
- 42 Saint John St
- 37 Saint John St
- 38 Saint John St
- 96 Saint John St
- 35 Saint John St
Your Personal Tour Guide
Ask me questions while you tour the home.