
Seller's Agent in 2025
Naomi Clark
KEY Real Estate Services LLC
(860) 383-6561
1 in this area
77 Total Sales
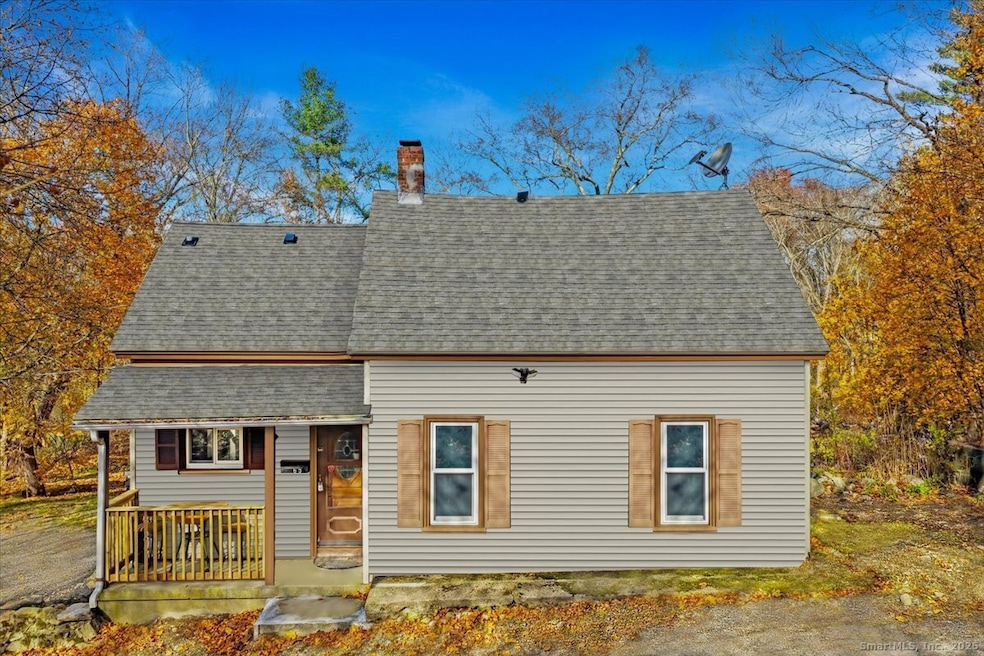
**Multiple offers have been received, please submit all offers by Monday November 24th 9am** Discover the perfect blend of comfort, character, and natural beauty at 65 Stone Street in Killingly, tucked away on a quiet street and set on 1.6 acres that backs up to a peaceful pond. Inside, an inviting kitchen with granite countertops opens to warm living spaces highlighted by wood flooring that flows through the main level of the home. The thoughtfully remodeled main-level bathroom and added second bathroom upstairs provide modern convenience, while the bright four-season sunroom offers a relaxing space to enjoy the view year-round. A new mini-split system, two charming wood stoves, a new septic system, and a new deck round out the property's many updates. With its serene setting close to everyday amenities, this home offers the perfect mix of privacy, comfort, and effortless living. Schedule your tour today!
Last Agent to Sell the Property
KEY Real Estate Services LLC Brokerage Phone: (860) 499-4549 License #RES.0822011 Listed on: 11/20/2025
| Date | Type | Sale Price | Title Company |
|---|---|---|---|
| Warranty Deed | $292,000 | -- | |
| Warranty Deed | $63,000 | None Available | |
| Warranty Deed | $63,000 | None Available | |
| Quit Claim Deed | -- | -- | |
| Quit Claim Deed | -- | -- | |
| Quit Claim Deed | -- | -- | |
| Quit Claim Deed | -- | -- | |
| Quit Claim Deed | $6,850 | -- | |
| Quit Claim Deed | $6,850 | -- | |
| Foreclosure Deed | -- | -- | |
| Foreclosure Deed | -- | -- |
| Date | Status | Loan Amount | Loan Type |
|---|---|---|---|
| Open | $283,240 | New Conventional | |
| Previous Owner | $151,000 | No Value Available |
| Date | Event | Price | List to Sale | Price per Sq Ft |
|---|---|---|---|---|
| 12/19/2025 12/19/25 | Sold | $292,000 | +4.3% | $424 / Sq Ft |
| 12/19/2025 12/19/25 | Pending | -- | -- | -- |
| 11/20/2025 11/20/25 | For Sale | $280,000 | -- | $407 / Sq Ft |
| Year | Tax Paid | Tax Assessment Tax Assessment Total Assessment is a certain percentage of the fair market value that is determined by local assessors to be the total taxable value of land and additions on the property. | Land | Improvement |
|---|---|---|---|---|
| 2025 | $1,050 | $44,760 | $36,760 | $8,000 |
| 2024 | $988 | $44,760 | $36,760 | $8,000 |
| 2023 | $1,861 | $64,940 | $30,430 | $34,510 |
| 2022 | $1,692 | $62,860 | $28,350 | $34,510 |
| 2021 | $1,692 | $62,860 | $28,350 | $34,510 |
| 2020 | $1,656 | $62,860 | $28,350 | $34,510 |
| 2019 | $1,688 | $62,860 | $28,350 | $34,510 |
| 2017 | $1,350 | $46,200 | $18,690 | $27,510 |
| 2016 | $1,345 | $46,200 | $18,690 | $27,510 |
| 2015 | $2,152 | $73,430 | $18,690 | $54,740 |
| 2014 | $2,093 | $73,430 | $18,690 | $54,740 |
Seller's Agent in 2025
Naomi Clark
KEY Real Estate Services LLC
(860) 383-6561
1 in this area
77 Total Sales
Buyer's Agent in 2025
Joscelyn McPherson
Priority Real Estate Group,LLC
(860) 861-8265
2 in this area
31 Total Sales
Buyer Co-Listing Agent in 2025
Cynthia Cingranelli-Tagliaferri
Priority Real Estate Group,LLC
(860) 710-5729
2 in this area
144 Total Sales
Source: SmartMLS
MLS Number: 24139337
APN: KILL-000176-000000-000111
Disclaimer: Certain information contained herein is derived from information provided by parties other than Homes.com. All information provided is deemed reliable, but is not guaranteed to be accurate and should be independently verified.
![]() IDX information is provided exclusively for personal, non-commercial use, and may not be used for any purpose other than to identify prospective properties consumers may be interested in purchasing. Information is deemed reliable but not guaranteed.
IDX information is provided exclusively for personal, non-commercial use, and may not be used for any purpose other than to identify prospective properties consumers may be interested in purchasing. Information is deemed reliable but not guaranteed.
Ask me questions while you tour the home.