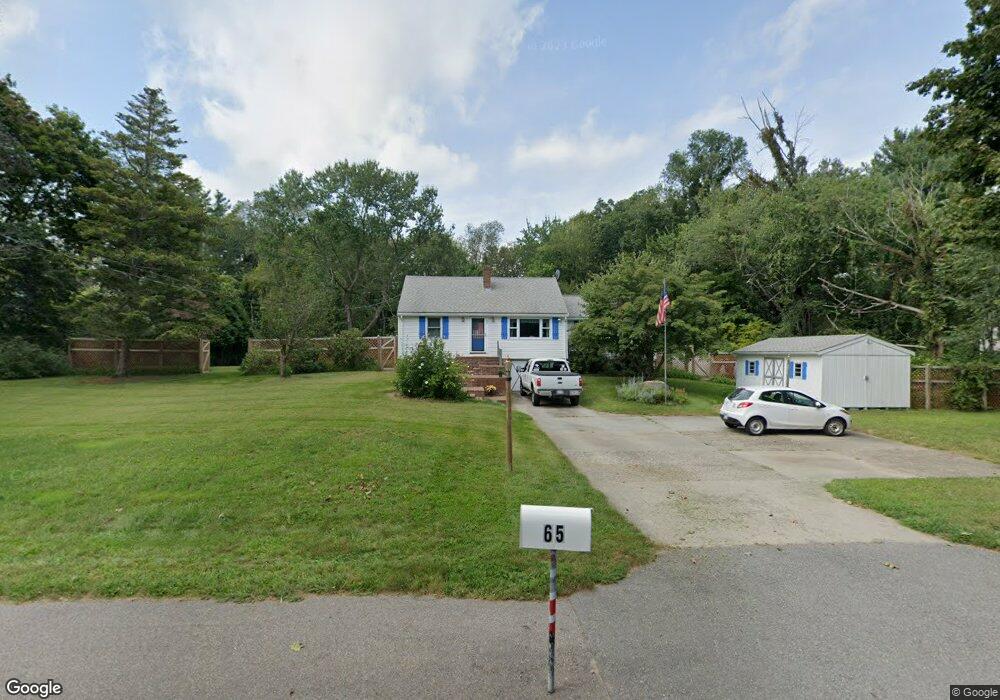
65 Summer St Medway, MA 02053
Estimated Value: $528,280 - $2,520,000
3
Beds
1
Bath
1,425
Sq Ft
$742/Sq Ft
Est. Value
About This Home
This home is located at 65 Summer St, Medway, MA 02053 and is currently estimated at $1,057,570, approximately $742 per square foot. 65 Summer St is a home located in Norfolk County with nearby schools including John D. McGovern Elementary School, Burke-Memorial Elementary, and Medway Middle School.
Ownership History
Date
Name
Owned For
Owner Type
Purchase Details
Closed on
Dec 22, 2010
Sold by
Marshall Wayne E
Bought by
Marshall Wayne E and Marshall Sheila M
Current Estimated Value
Purchase Details
Closed on
Jun 15, 1999
Sold by
Marshall Wayne E and Marshall Sheila A
Bought by
Maple Sands Corp
Home Financials for this Owner
Home Financials are based on the most recent Mortgage that was taken out on this home.
Original Mortgage
$612,000
Interest Rate
6.9%
Mortgage Type
Purchase Money Mortgage
Create a Home Valuation Report for This Property
The Home Valuation Report is an in-depth analysis detailing your home's value as well as a comparison with similar homes in the area
Home Values in the Area
Average Home Value in this Area
Purchase History
| Date | Buyer | Sale Price | Title Company |
|---|---|---|---|
| Marshall Wayne E | -- | -- | |
| Maple Sands Corp | $660,000 | -- |
Source: Public Records
Mortgage History
| Date | Status | Borrower | Loan Amount |
|---|---|---|---|
| Previous Owner | Maple Sands Corp | $612,000 |
Source: Public Records
Tax History
| Year | Tax Paid | Tax Assessment Tax Assessment Total Assessment is a certain percentage of the fair market value that is determined by local assessors to be the total taxable value of land and additions on the property. | Land | Improvement |
|---|---|---|---|---|
| 2025 | $6,874 | $482,400 | $269,600 | $212,800 |
| 2024 | $6,947 | $482,400 | $269,600 | $212,800 |
| 2023 | $6,754 | $423,700 | $232,200 | $191,500 |
| 2022 | $6,618 | $390,900 | $207,300 | $183,600 |
| 2021 | $6,179 | $353,900 | $186,600 | $167,300 |
| 2020 | $5,777 | $330,100 | $165,900 | $164,200 |
| 2019 | $5,602 | $330,100 | $165,900 | $164,200 |
| 2018 | $5,436 | $307,800 | $145,100 | $162,700 |
| 2017 | $5,249 | $292,900 | $134,800 | $158,100 |
| 2016 | $5,098 | $281,500 | $129,800 | $151,700 |
| 2015 | $4,943 | $271,000 | $122,300 | $148,700 |
| 2014 | $4,712 | $250,100 | $119,600 | $130,500 |
Source: Public Records
Map
Nearby Homes
- 6 Kingson Ln Unit 2
- 2 Kingson Ln Unit 2
- 6 Freedom Trail
- 39 West St
- 56 Fisher St
- 10 Franklin St
- 8 Winthrop St
- 3 Nobscott Rd
- 1391 Pond St
- 23 Cedar Farms Rd
- 19 Evergreen St Unit A
- 462 Hartford Ave
- 4 Linda Ln
- 5 Richardson St
- 22 Granite St
- 3 Thayer Rd
- 15 Fox Run Rd
- 79 Lovering St Unit B
- 4 Bullard Cir
- 8 Liberty Rd
Your Personal Tour Guide
Ask me questions while you tour the home.