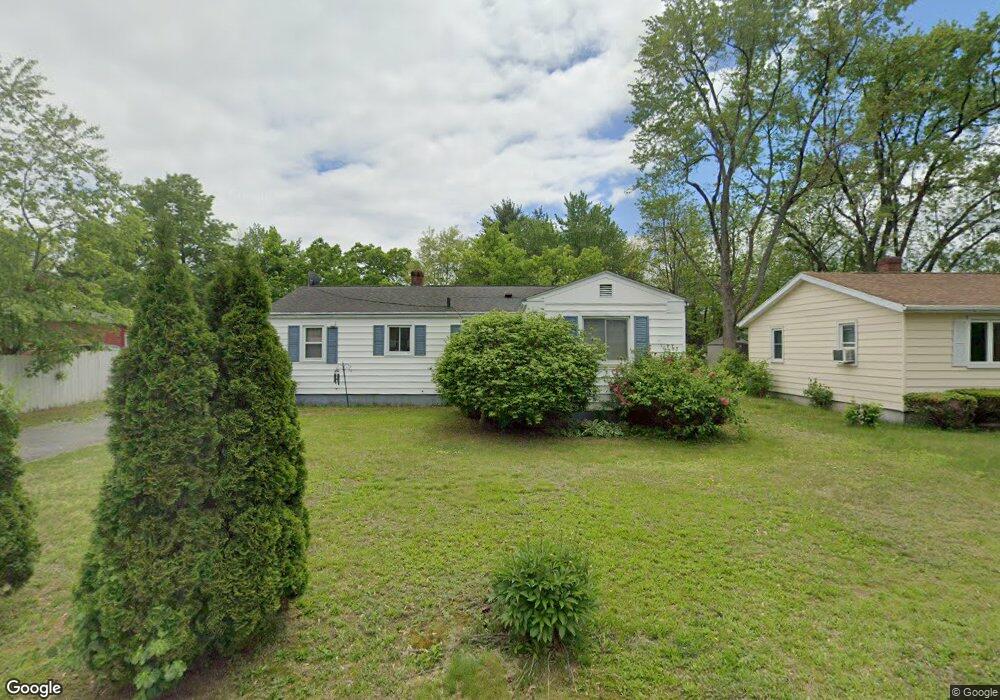
65 Switzer Ave Springfield, MA 01109
Pine Point NeighborhoodEstimated Value: $268,501 - $291,000
3
Beds
2
Baths
1,110
Sq Ft
$250/Sq Ft
Est. Value
About This Home
This home is located at 65 Switzer Ave, Springfield, MA 01109 and is currently estimated at $277,625, approximately $250 per square foot. 65 Switzer Ave is a home located in Hampden County with nearby schools including Hiram L. Dorman Elementary, John F. Kennedy Academy, and Springfield Central High School.
Ownership History
Date
Name
Owned For
Owner Type
Purchase Details
Closed on
Nov 7, 2008
Sold by
Ocasio Miguel A and Ocasio Pura C
Bought by
Ocasio Carmelo A and Ocasio Miguel E
Current Estimated Value
Purchase Details
Closed on
Aug 10, 2005
Sold by
Source Nine Dev Llc and Pafumi James A
Bought by
Ocasiio Miguel and Ocasiio Pura
Purchase Details
Closed on
May 13, 2005
Sold by
Harris Arlet Nicholas and Nicholas Cheryl
Bought by
Source Nine Dev Llc
Create a Home Valuation Report for This Property
The Home Valuation Report is an in-depth analysis detailing your home's value as well as a comparison with similar homes in the area
Home Values in the Area
Average Home Value in this Area
Purchase History
| Date | Buyer | Sale Price | Title Company |
|---|---|---|---|
| Ocasio Carmelo A | -- | -- | |
| Ocasiio Miguel | $137,000 | -- | |
| Source Nine Dev Llc | $90,000 | -- |
Source: Public Records
Tax History
| Year | Tax Paid | Tax Assessment Tax Assessment Total Assessment is a certain percentage of the fair market value that is determined by local assessors to be the total taxable value of land and additions on the property. | Land | Improvement |
|---|---|---|---|---|
| 2025 | $3,360 | $214,300 | $38,800 | $175,500 |
| 2024 | $3,124 | $194,500 | $38,800 | $155,700 |
| 2023 | $3,369 | $197,600 | $34,400 | $163,200 |
| 2022 | $3,188 | $169,400 | $32,100 | $137,300 |
| 2021 | $3,015 | $159,500 | $29,200 | $130,300 |
| 2020 | $2,939 | $150,500 | $29,200 | $121,300 |
| 2019 | $2,464 | $125,200 | $30,200 | $95,000 |
| 2018 | $2,369 | $120,400 | $30,200 | $90,200 |
| 2017 | $2,389 | $121,500 | $33,300 | $88,200 |
| 2016 | $2,259 | $114,900 | $33,300 | $81,600 |
| 2015 | $2,172 | $110,400 | $33,300 | $77,100 |
Source: Public Records
Map
Nearby Homes
Your Personal Tour Guide
Ask me questions while you tour the home.