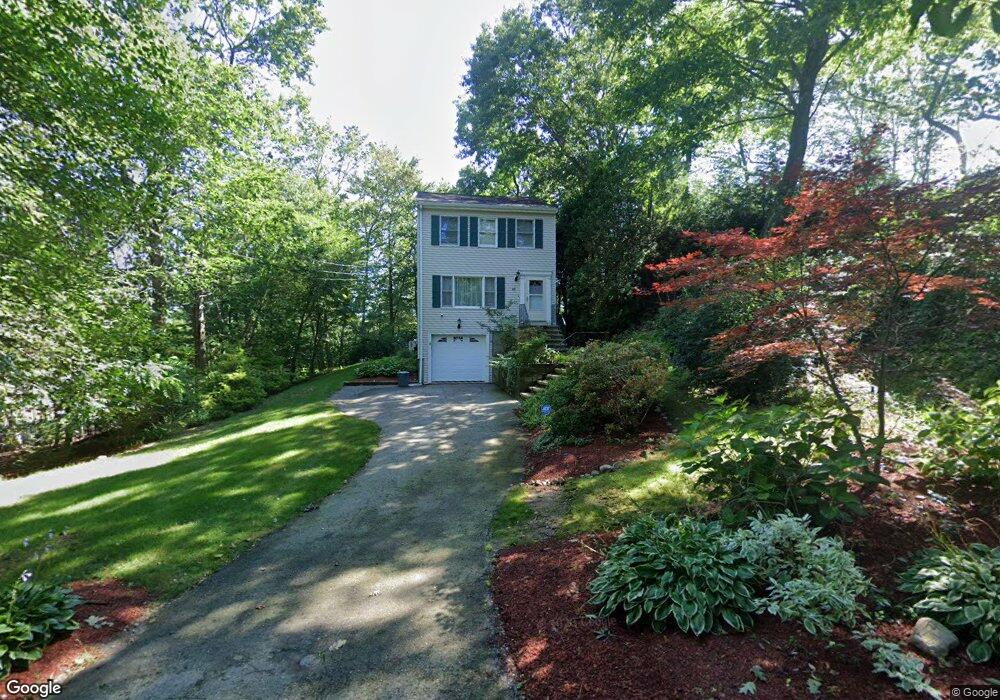
65 Sycamore Rd Wayland, MA 01778
Estimated Value: $714,000 - $822,000
3
Beds
2
Baths
1,280
Sq Ft
$597/Sq Ft
Est. Value
About This Home
This home is located at 65 Sycamore Rd, Wayland, MA 01778 and is currently estimated at $764,118, approximately $596 per square foot. 65 Sycamore Rd is a home located in Middlesex County with nearby schools including Wayland High School, Christa McAuliffe Charter School, and Veritas Christian Academy.
Ownership History
Date
Name
Owned For
Owner Type
Purchase Details
Closed on
Nov 6, 2009
Sold by
Maurer Patrick M and Maurer Mala R
Bought by
Moshinsky Deborah
Current Estimated Value
Home Financials for this Owner
Home Financials are based on the most recent Mortgage that was taken out on this home.
Original Mortgage
$276,000
Interest Rate
5.06%
Mortgage Type
Purchase Money Mortgage
Purchase Details
Closed on
Jul 14, 2000
Sold by
Defren Todd S and Defren Sian F
Bought by
Maurer Patrick M and Maurer Mala R
Purchase Details
Closed on
Jun 28, 1996
Sold by
Elken Karl H
Bought by
Defren Todd S and Defren Sian F
Purchase Details
Closed on
Apr 28, 1995
Sold by
James St Rt and Mackenzie
Bought by
Elken Karl H
Purchase Details
Closed on
Aug 24, 1994
Sold by
Grealey Donald J and Grealey Lorraine
Bought by
James St Rt and Mackenzie
Create a Home Valuation Report for This Property
The Home Valuation Report is an in-depth analysis detailing your home's value as well as a comparison with similar homes in the area
Home Values in the Area
Average Home Value in this Area
Purchase History
| Date | Buyer | Sale Price | Title Company |
|---|---|---|---|
| Moshinsky Deborah | $345,000 | -- | |
| Moshinsky Deborah | $345,000 | -- | |
| Maurer Patrick M | $310,000 | -- | |
| Defren Todd S | $189,000 | -- | |
| Elken Karl H | $182,750 | -- | |
| James St Rt | $50,000 | -- |
Source: Public Records
Mortgage History
| Date | Status | Borrower | Loan Amount |
|---|---|---|---|
| Open | James St Rt | $274,000 | |
| Closed | Moshinsky Deborah | $276,000 |
Source: Public Records
Tax History Compared to Growth
Tax History
| Year | Tax Paid | Tax Assessment Tax Assessment Total Assessment is a certain percentage of the fair market value that is determined by local assessors to be the total taxable value of land and additions on the property. | Land | Improvement |
|---|---|---|---|---|
| 2025 | $9,772 | $625,200 | $350,100 | $275,100 |
| 2024 | $9,250 | $596,000 | $333,400 | $262,600 |
| 2023 | $8,721 | $523,800 | $303,100 | $220,700 |
| 2022 | $8,375 | $456,400 | $251,000 | $205,400 |
| 2021 | $8,030 | $433,600 | $228,200 | $205,400 |
| 2020 | $7,701 | $433,600 | $228,200 | $205,400 |
| 2019 | $7,447 | $407,400 | $217,400 | $190,000 |
| 2018 | $7,124 | $395,100 | $217,400 | $177,700 |
| 2017 | $6,875 | $379,000 | $207,000 | $172,000 |
| 2016 | $6,379 | $367,900 | $203,000 | $164,900 |
| 2015 | $6,530 | $355,100 | $203,000 | $152,100 |
Source: Public Records
Map
Nearby Homes
- 353 Old Connecticut Path
- 96 Lakeshore Dr
- 96 Lake Shore Dr
- 35 Wallace Rd
- 454 Old Connecticut Path
- 22 Lakeshore Dr
- 108 Dudley Rd
- 123 Dudley Rd
- 233 Lakeshore Dr
- 47 Pequot Rd
- 15 Crest Rd
- 37 Pequot Rd
- 15 Parkridge Rd
- 26 Dudley Rd
- 3 Keith Rd
- 260 Cochituate Rd
- 192 School St
- 154 Danforth St
- 177 Main St
- 208 Cochituate Rd
- 63 Sycamore Rd
- 15 Woodland Rd
- 19 Woodland Rd
- 64 Sycamore Rd
- 62 Sycamore Rd
- 21 Woodland Rd
- 47 Pilgrim Path
- 365 Old Connecticut Path
- 48 Pilgrim Path
- 28 Hawthorne Rd
- 53 Sycamore Rd
- 10 Birch Rd
- 22 Hawthorne Rd
- 4 Woodland Rd
- 374 Old Connecticut Path
- 385 Old Connecticut Path
- 370 Old Connecticut Path
- 370 Old Conn Path
- 370 Old Conn Path
- 18 Hawthorne Rd