65 Tanqueray St Sharpsburg, GA 30277
Estimated Value: $506,446 - $558,000
4
Beds
4
Baths
3,265
Sq Ft
$162/Sq Ft
Est. Value
About This Home
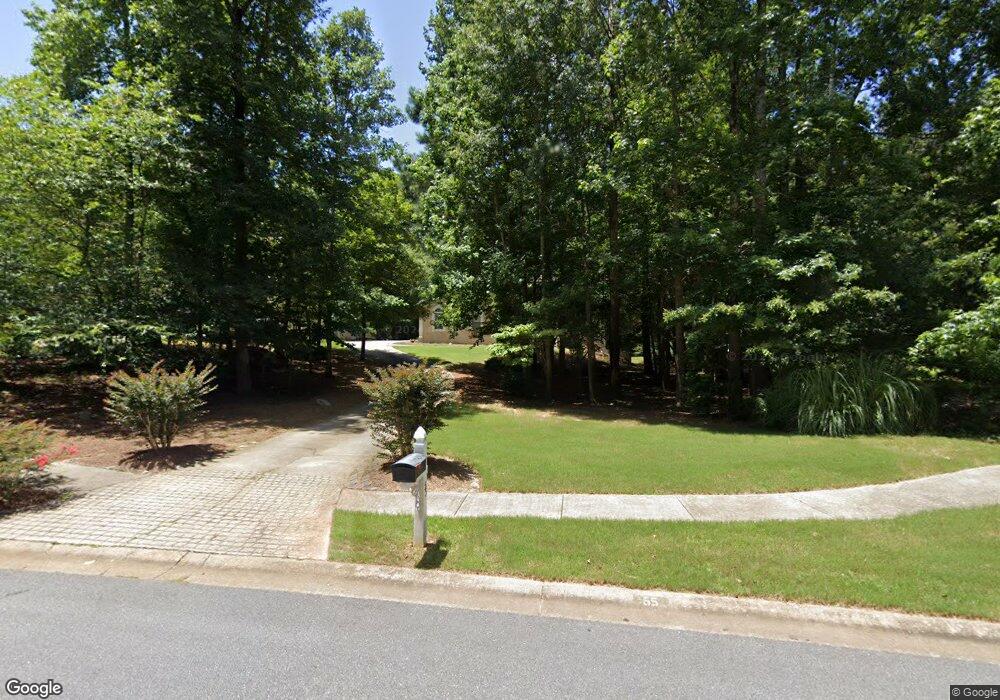
This home is located at 65 Tanqueray St, Sharpsburg, GA 30277 and is currently estimated at $528,112, approximately $161 per square foot. 65 Tanqueray St is a home located in Coweta County with nearby schools including Canongate Elementary School, Madras Middle School, and Northgate High School.
Ownership History
Date
Name
Owned For
Owner Type
Purchase Details
Closed on
Nov 18, 2011
Sold by
Federal Home Loan Mortgage Corporation
Bought by
Trinh Cao Chuong Duc and Tran Thuy Hang Thi
Current Estimated Value
Home Financials for this Owner
Home Financials are based on the most recent Mortgage that was taken out on this home.
Original Mortgage
$136,500
Outstanding Balance
$93,412
Interest Rate
4.17%
Mortgage Type
New Conventional
Estimated Equity
$434,700
Purchase Details
Closed on
May 3, 2011
Sold by
Bac Home Loans Servicing Lp
Bought by
Federal Home Loan Mortgage Corporation
Purchase Details
Closed on
Nov 23, 1992
Bought by
Frenchy Community De
Purchase Details
Closed on
Feb 20, 1973
Bought by
Glass Lamar F Dr Et
Create a Home Valuation Report for This Property
The Home Valuation Report is an in-depth analysis detailing your home's value as well as a comparison with similar homes in the area
Home Values in the Area
Average Home Value in this Area
Purchase History
| Date | Buyer | Sale Price | Title Company |
|---|---|---|---|
| Trinh Cao Chuong Duc | $195,100 | -- | |
| Federal Home Loan Mortgage Corporation | -- | -- | |
| Bac Home Loans Servicing Lp | $212,675 | -- | |
| Bac Home Loans Servicing Lp | $212,700 | -- | |
| Frenchy Community De | $1,185,900 | -- | |
| Glass Lamar F Dr Et | $123,600 | -- |
Source: Public Records
Mortgage History
| Date | Status | Borrower | Loan Amount |
|---|---|---|---|
| Open | Trinh Cao Chuong Duc | $136,500 |
Source: Public Records
Tax History Compared to Growth
Tax History
| Year | Tax Paid | Tax Assessment Tax Assessment Total Assessment is a certain percentage of the fair market value that is determined by local assessors to be the total taxable value of land and additions on the property. | Land | Improvement |
|---|---|---|---|---|
| 2025 | $4,976 | $222,254 | $32,000 | $190,254 |
| 2024 | $4,525 | $197,471 | $32,000 | $165,471 |
| 2023 | $4,525 | $190,661 | $32,000 | $158,661 |
| 2022 | $4,475 | $184,421 | $32,000 | $152,421 |
| 2021 | $3,849 | $149,058 | $20,000 | $129,058 |
| 2020 | $3,873 | $149,058 | $20,000 | $129,058 |
| 2019 | $4,116 | $143,790 | $20,000 | $123,790 |
| 2018 | $4,124 | $143,790 | $20,000 | $123,790 |
| 2017 | $3,832 | $133,886 | $20,000 | $113,886 |
| 2016 | $3,789 | $133,886 | $20,000 | $113,886 |
| 2015 | $3,390 | $122,003 | $20,000 | $102,003 |
| 2014 | $2,918 | $106,158 | $20,000 | $86,158 |
Source: Public Records
Map
Nearby Homes
- 28 Border Point
- 104 Ashland Trail
- 110 Kylemore Pass
- 100 Ashland Trail
- 150 Kylemore Pass
- 100 Clydesdale Ct
- 200 Chaparral Trace
- 20 Skipton Ct
- 11 Line Creek Cir
- 135 Crimson Ridge
- 575 Laurelwood Dr
- 2185 Castle Lake Dr
- 121 Northwoods Rd
- 9 Warrior Way
- 70 N Strathmore Dr
- 40 Wenham Ln
- 259 Strathmore Dr Unit 3
- 95 Tyler Woods Dr
- 475 Castlewood Rd
- 240 Lynnwood Ave
- 55 Tanqueray St
- 75 Tanqueray St
- 45 Tanqueray St
- 80 Tanqueray St
- 85 Tanqueray St
- 0 Tanqueray St Unit 8334460
- 0 Tanqueray St Unit 8163763
- 0 Tanqueray St Unit 7634061
- 0 Tanqueray St
- 31 Border Point
- 50 Tanqueray St
- 35 Tanqueray St
- 90 Tanqueray St
- 95 Tanqueray St
- 40 Tanqueray St
- 1680 Palmetto Tyrone Rd
- 25 Tanqueray St
- 100 Tanqueray St
- 1708 Palmetto Tyrone Rd
- 0 Border Point Unit 7434151