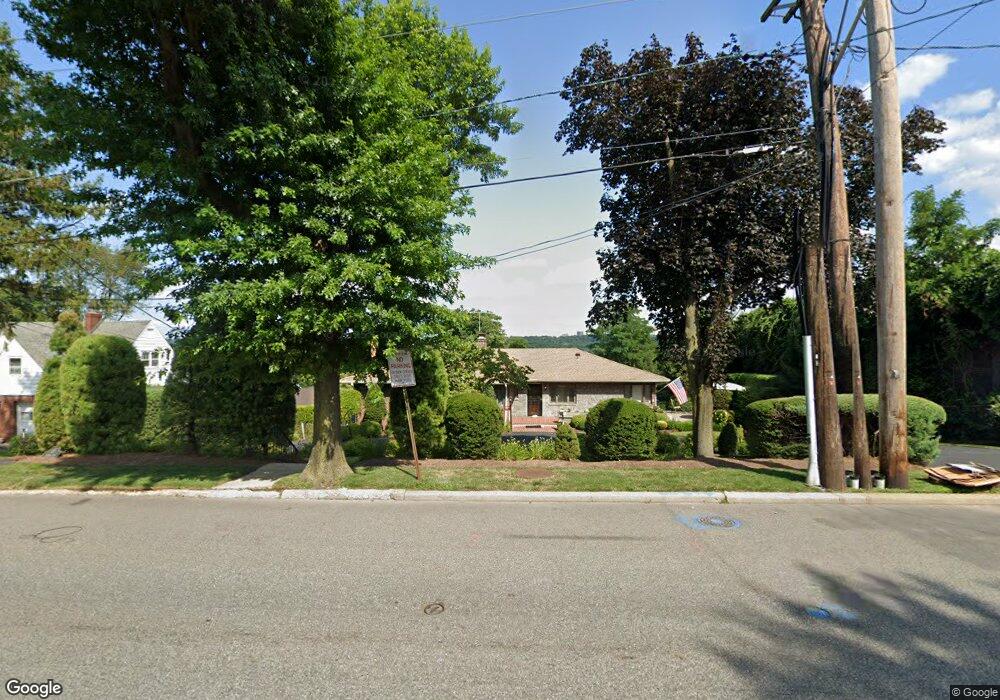
65 Teaneck Rd Teaneck, NJ 07666
Estimated Value: $741,000 - $864,000
--
Bed
--
Bath
2,070
Sq Ft
$389/Sq Ft
Est. Value
About This Home
This home is located at 65 Teaneck Rd, Teaneck, NJ 07666 and is currently estimated at $805,224, approximately $388 per square foot. 65 Teaneck Rd is a home located in Bergen County with nearby schools including Teaneck Senior High School, Academy of Greatness & Excellence, and Bogota Middle School.
Ownership History
Date
Name
Owned For
Owner Type
Purchase Details
Closed on
Sep 21, 2000
Bought by
Thornton Yvonne S
Current Estimated Value
Home Financials for this Owner
Home Financials are based on the most recent Mortgage that was taken out on this home.
Original Mortgage
$50,000
Interest Rate
7.81%
Purchase Details
Closed on
Dec 23, 1982
Bought by
Mcclelland Sj and Mcclelland Thornton,Ys
Create a Home Valuation Report for This Property
The Home Valuation Report is an in-depth analysis detailing your home's value as well as a comparison with similar homes in the area
Home Values in the Area
Average Home Value in this Area
Purchase History
| Date | Buyer | Sale Price | Title Company |
|---|---|---|---|
| Thornton Yvonne S | -- | -- | |
| Thornton Yvonne S | -- | -- | |
| Mcclelland Sj | $145,000 | -- |
Source: Public Records
Mortgage History
| Date | Status | Borrower | Loan Amount |
|---|---|---|---|
| Previous Owner | Thornton Yvonne S | $50,000 |
Source: Public Records
Tax History Compared to Growth
Tax History
| Year | Tax Paid | Tax Assessment Tax Assessment Total Assessment is a certain percentage of the fair market value that is determined by local assessors to be the total taxable value of land and additions on the property. | Land | Improvement |
|---|---|---|---|---|
| 2025 | $16,096 | $737,000 | $297,200 | $439,800 |
| 2024 | $15,691 | $737,000 | $297,200 | $439,800 |
| 2023 | $15,382 | $475,200 | $194,800 | $280,400 |
| 2022 | $15,382 | $475,200 | $194,800 | $280,400 |
| 2021 | $15,192 | $475,200 | $194,800 | $280,400 |
| 2020 | $15,368 | $475,200 | $194,800 | $280,400 |
| 2019 | $15,192 | $475,200 | $194,800 | $280,400 |
| 2018 | $15,078 | $475,200 | $194,800 | $280,400 |
| 2017 | $14,936 | $475,200 | $194,800 | $280,400 |
| 2016 | $14,712 | $475,200 | $194,800 | $280,400 |
| 2015 | $14,479 | $475,200 | $194,800 | $280,400 |
| 2014 | $14,351 | $558,200 | $248,800 | $309,400 |
Source: Public Records
Map
Nearby Homes