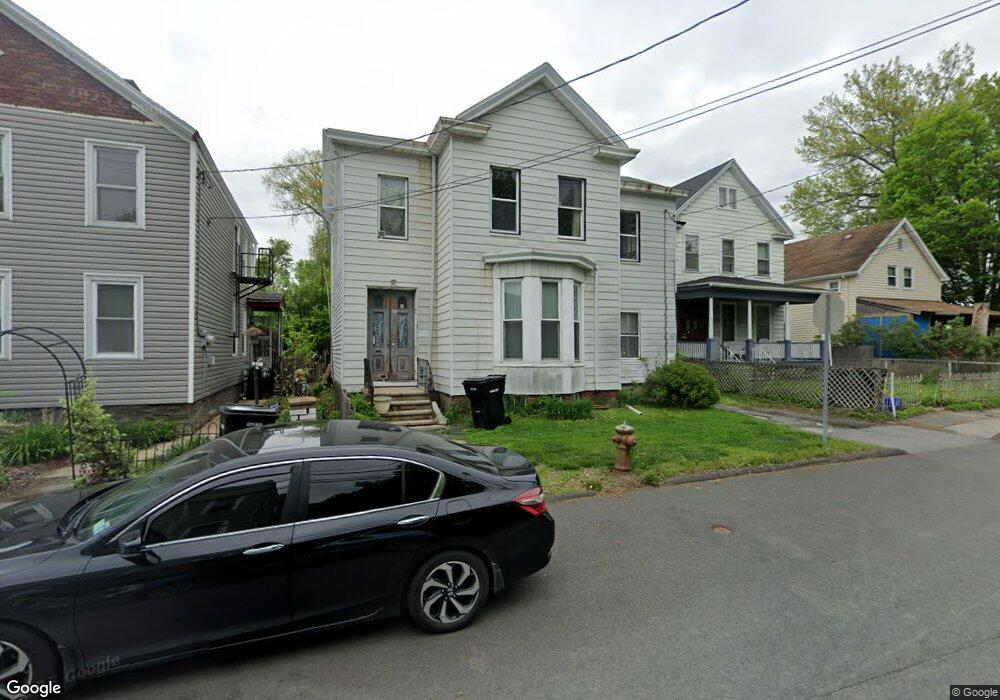
65 Thompson St Troy, NY 12180
South Troy NeighborhoodEstimated Value: $172,000 - $184,000
4
Beds
2
Baths
2,188
Sq Ft
$81/Sq Ft
Est. Value
About This Home
This home is located at 65 Thompson St, Troy, NY 12180 and is currently estimated at $177,872, approximately $81 per square foot. 65 Thompson St is a home located in Rensselaer County with nearby schools including Carroll Hill School, Troy Middle School, and Troy High School.
Ownership History
Date
Name
Owned For
Owner Type
Purchase Details
Closed on
May 23, 2014
Sold by
Desormeau Michele
Bought by
Conway Lynn
Current Estimated Value
Purchase Details
Closed on
Apr 22, 2014
Sold by
Desormeau Desormeau M and Desormeau Allyse C
Bought by
Desormeau Michele
Purchase Details
Closed on
Apr 13, 2000
Sold by
Trustee The Bank Of Ny
Bought by
Spyropoulos Grace T
Purchase Details
Closed on
Jan 20, 1994
Sold by
Pludrzynski John and Pludrzynski Mary
Bought by
Hilder William and Ryan Carle
Create a Home Valuation Report for This Property
The Home Valuation Report is an in-depth analysis detailing your home's value as well as a comparison with similar homes in the area
Home Values in the Area
Average Home Value in this Area
Purchase History
| Date | Buyer | Sale Price | Title Company |
|---|---|---|---|
| Conway Lynn | -- | -- | |
| Desormeau Michele | -- | -- | |
| Spyropoulos Grace T | $14,000 | -- | |
| Hilder William | $65,000 | -- |
Source: Public Records
Tax History
| Year | Tax Paid | Tax Assessment Tax Assessment Total Assessment is a certain percentage of the fair market value that is determined by local assessors to be the total taxable value of land and additions on the property. | Land | Improvement |
|---|---|---|---|---|
| 2024 | $3,643 | $78,000 | $25,500 | $52,500 |
| 2023 | $2,892 | $78,000 | $25,500 | $52,500 |
| 2022 | $3,534 | $78,000 | $25,500 | $52,500 |
| 2021 | $888 | $78,000 | $25,500 | $52,500 |
| 2020 | $1,796 | $78,000 | $25,500 | $52,500 |
| 2019 | $2,551 | $78,000 | $25,500 | $52,500 |
| 2018 | $2,551 | $78,000 | $25,500 | $52,500 |
| 2017 | $2,540 | $78,000 | $25,500 | $52,500 |
| 2016 | $3,357 | $78,000 | $25,500 | $52,500 |
| 2015 | -- | $78,000 | $25,500 | $52,500 |
| 2014 | -- | $78,000 | $25,500 | $52,500 |
Source: Public Records
Map
Nearby Homes
Your Personal Tour Guide
Ask me questions while you tour the home.