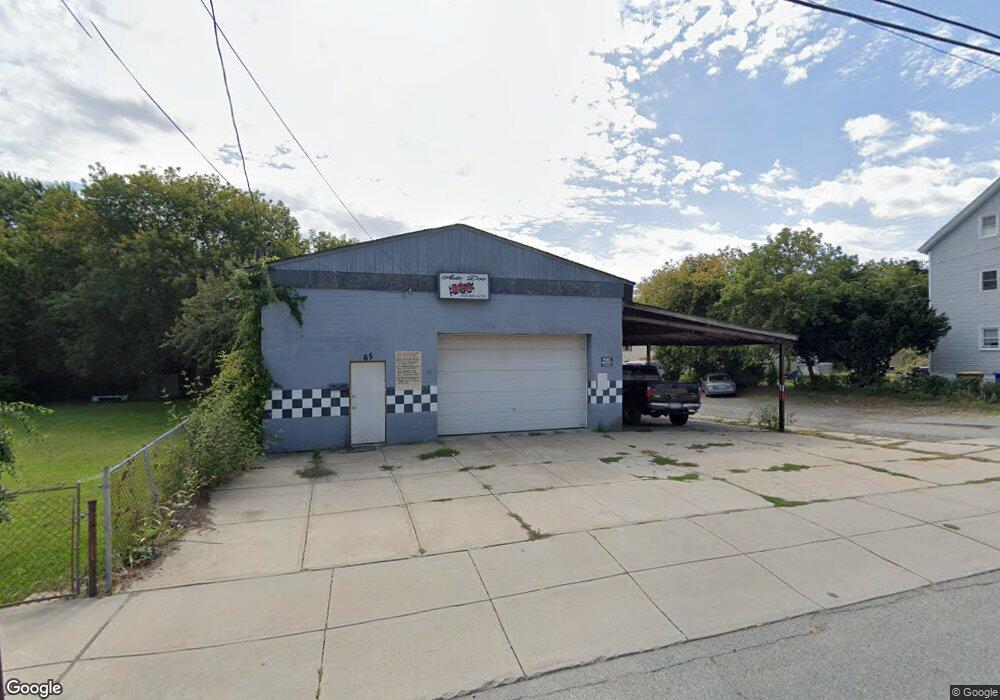
65 Tower St Fall River, MA 02724
Father Kelly NeighborhoodEstimated Value: $319,854
4
Beds
1
Bath
1,288
Sq Ft
$248/Sq Ft
Est. Value
About This Home
This home is located at 65 Tower St, Fall River, MA 02724 and is currently estimated at $319,854, approximately $248 per square foot. 65 Tower St is a home located in Bristol County with nearby schools including Henry Lord Community School, B M C Durfee High School, and Argosy Collegiate Charter School.
Ownership History
Date
Name
Owned For
Owner Type
Purchase Details
Closed on
Dec 30, 2020
Sold by
Amaral Stephanie and Oliveira Ruben M
Bought by
Pereira Amanda and Pereira Paulo
Current Estimated Value
Home Financials for this Owner
Home Financials are based on the most recent Mortgage that was taken out on this home.
Original Mortgage
$214,000
Outstanding Balance
$190,962
Interest Rate
2.7%
Mortgage Type
New Conventional
Estimated Equity
$128,892
Purchase Details
Closed on
Nov 4, 2009
Sold by
Lopes James and Lopes Roger
Bought by
Oliveira Ruben M and Amaral Stephanie
Create a Home Valuation Report for This Property
The Home Valuation Report is an in-depth analysis detailing your home's value as well as a comparison with similar homes in the area
Home Values in the Area
Average Home Value in this Area
Purchase History
| Date | Buyer | Sale Price | Title Company |
|---|---|---|---|
| Pereira Amanda | $224,000 | None Available | |
| Oliveira Ruben M | $150,000 | -- |
Source: Public Records
Mortgage History
| Date | Status | Borrower | Loan Amount |
|---|---|---|---|
| Open | Pereira Amanda | $214,000 |
Source: Public Records
Tax History
| Year | Tax Paid | Tax Assessment Tax Assessment Total Assessment is a certain percentage of the fair market value that is determined by local assessors to be the total taxable value of land and additions on the property. | Land | Improvement |
|---|---|---|---|---|
| 2025 | $5,536 | $232,300 | $106,100 | $126,200 |
| 2024 | $5,442 | $227,300 | $101,100 | $126,200 |
| 2023 | $4,719 | $183,200 | $87,800 | $95,400 |
| 2022 | $4,952 | $183,200 | $87,800 | $95,400 |
| 2021 | $4,271 | $143,800 | $81,300 | $62,500 |
| 2020 | $4,328 | $141,400 | $81,000 | $60,400 |
| 2019 | $4,434 | $141,400 | $81,000 | $60,400 |
| 2018 | $4,400 | $141,400 | $81,000 | $60,400 |
| 2017 | $4,332 | $141,400 | $81,000 | $60,400 |
| 2016 | $4,119 | $141,400 | $81,000 | $60,400 |
| 2015 | $3,979 | $141,400 | $81,000 | $60,400 |
| 2014 | $3,773 | $141,400 | $81,000 | $60,400 |
Source: Public Records
Map
Nearby Homes
- 119 23 Orswell
- 33 Tower St
- 60 Tower St
- 21 Tower St
- 81 Tower St
- 112 Tower St
- 73 Orswell St Unit 2E
- 73 Orswell St
- 99 Orswell St
- 10 Tower St
- 99 Tower St
- 201 Laurel St
- 111 Orswell St
- 47 Orswell St
- 47 Orswell St Unit 2E
- 47 Orswell St Unit 2W
- 47 Orswell St Unit 1
- 165 Laurel St
- 211 Laurel St
- 119 Orswell St
Your Personal Tour Guide
Ask me questions while you tour the home.