Estimated Value: $550,000 - $580,000
Studio
--
Bath
1,936
Sq Ft
$289/Sq Ft
Est. Value
About This Home
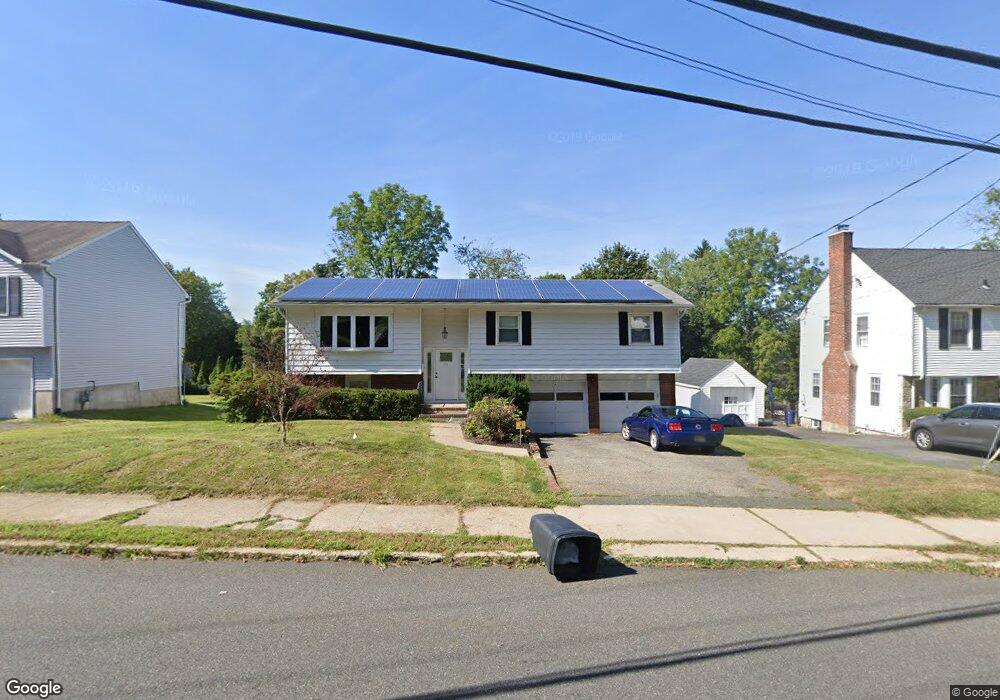
This home is located at 65 Van Nostrand Ave, Dover, NJ 07801 and is currently estimated at $559,640, approximately $289 per square foot. 65 Van Nostrand Ave is a home located in Morris County with nearby schools including Dover Middle School, Dover High School, and Gottesman RTW Academy.
Ownership History
Date
Name
Owned For
Owner Type
Purchase Details
Closed on
Aug 28, 2009
Sold by
Visioli Armando J and Visioli Ada A
Bought by
Semel Deborah and Blumfelds Aldis
Current Estimated Value
Home Financials for this Owner
Home Financials are based on the most recent Mortgage that was taken out on this home.
Original Mortgage
$259,462
Outstanding Balance
$169,859
Interest Rate
5.21%
Mortgage Type
FHA
Estimated Equity
$389,781
Create a Home Valuation Report for This Property
The Home Valuation Report is an in-depth analysis detailing your home's value as well as a comparison with similar homes in the area
Home Values in the Area
Average Home Value in this Area
Purchase History
| Date | Buyer | Sale Price | Title Company |
|---|---|---|---|
| Semel Deborah | $285,000 | Colonial Title & Abstract |
Source: Public Records
Mortgage History
| Date | Status | Borrower | Loan Amount |
|---|---|---|---|
| Open | Semel Deborah | $259,462 |
Source: Public Records
Tax History
| Year | Tax Paid | Tax Assessment Tax Assessment Total Assessment is a certain percentage of the fair market value that is determined by local assessors to be the total taxable value of land and additions on the property. | Land | Improvement |
|---|---|---|---|---|
| 2025 | $9,007 | $275,200 | $84,900 | $190,300 |
| 2024 | $8,688 | $275,200 | $84,900 | $190,300 |
Source: Public Records
Map
Nearby Homes
- 58 Conrad Place
- 37 Kearney St
- 51 Linwood Ave
- 3 Marble Ln
- 121 W Munson Ave
- 170 Park Heights Ave
- 142 W Blackwell St
- 5 A&B Dewey St
- 343 & 339 Quaker Church Rd
- 107 High St
- 12 Birch St
- 417 W Black Well St Ab
- 8 N Elk Ave
- 121 W Clinton St
- 42 5th Ave
- 12 Lincoln Ave
- 77B Highland Way
- 00 5th Ave
- 36 Kitchell Ave
- 179 Pequannock St
- 73 Van Nostrand Ave
- 55 Van Nostrand Ave
- 75 Van Nostrand Ave
- 45 Van Nostrand Ave
- 54 Knickerbocker Ave
- 48 Knickerbocker Ave
- 60 Knickerbocker Ave
- 77 Van Nostrand Ave
- 60 Van Nostrand Ave
- 42 Knickerbocker Ave
- 36 Van Nostrand Ave
- 66 Knickerbocker Ave
- 74 Van Nostrand Ave
- 34 Van Nostrand Ave
- 35 Van Nostrand Ave
- 32 Van Nostrand Ave
- 12 Overlook Ave
- 30 Van Nostrand Ave
- 48 Fred Terrace
- 79 Van Nostrand Ave
Your Personal Tour Guide
Ask me questions while you tour the home.