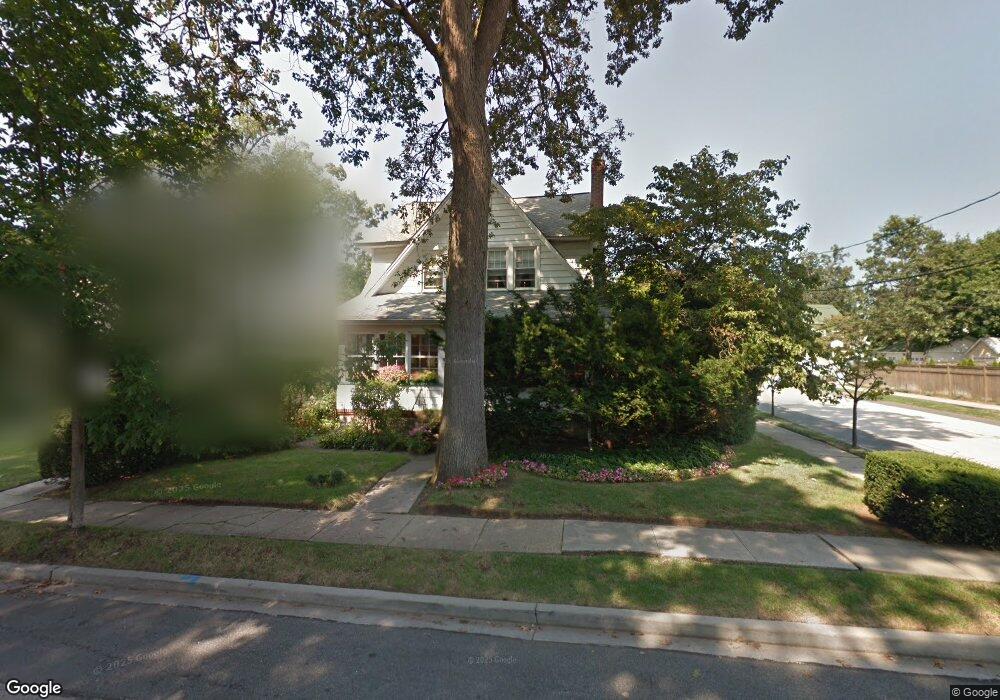
65 Vincent Place Lynbrook, NY 11563
Estimated Value: $748,102 - $777,000
4
Beds
2
Baths
1,706
Sq Ft
$447/Sq Ft
Est. Value
About This Home
This home is located at 65 Vincent Place, Lynbrook, NY 11563 and is currently estimated at $762,551, approximately $446 per square foot. 65 Vincent Place is a home located in Nassau County with nearby schools including East Rockaway Junior/Senior High School, Our Lady Of Peace School, and St Agnes Cathedral School.
Ownership History
Date
Name
Owned For
Owner Type
Purchase Details
Closed on
Aug 20, 2021
Sold by
Rodriguez Carlo and Rodriguez Arianny
Bought by
Brennan Kevin and Nunez Rebecca
Current Estimated Value
Home Financials for this Owner
Home Financials are based on the most recent Mortgage that was taken out on this home.
Original Mortgage
$621,000
Outstanding Balance
$562,595
Interest Rate
2.8%
Mortgage Type
New Conventional
Estimated Equity
$199,956
Purchase Details
Closed on
Jan 31, 2019
Sold by
Timothy Sheehan and James Sheehan Trustee
Bought by
Rodriguez Carlo and Rodriguez Arianny
Home Financials for this Owner
Home Financials are based on the most recent Mortgage that was taken out on this home.
Original Mortgage
$391,200
Interest Rate
4.5%
Mortgage Type
New Conventional
Create a Home Valuation Report for This Property
The Home Valuation Report is an in-depth analysis detailing your home's value as well as a comparison with similar homes in the area
Home Values in the Area
Average Home Value in this Area
Purchase History
| Date | Buyer | Sale Price | Title Company |
|---|---|---|---|
| Brennan Kevin | $690,000 | First American Title | |
| Brennan Kevin | $690,000 | First American Title | |
| Brennan Kevin | $690,000 | First American Title | |
| Rodriguez Carlo | $489,000 | None Available | |
| Rodriguez Carlo | $489,000 | None Available | |
| Rodriguez Carlo | $489,000 | None Available |
Source: Public Records
Mortgage History
| Date | Status | Borrower | Loan Amount |
|---|---|---|---|
| Open | Brennan Kevin | $621,000 | |
| Closed | Brennan Kevin | $621,000 | |
| Previous Owner | Rodriguez Carlo | $391,200 |
Source: Public Records
Tax History Compared to Growth
Tax History
| Year | Tax Paid | Tax Assessment Tax Assessment Total Assessment is a certain percentage of the fair market value that is determined by local assessors to be the total taxable value of land and additions on the property. | Land | Improvement |
|---|---|---|---|---|
| 2025 | $10,625 | $466 | $176 | $290 |
| 2024 | $1,031 | $466 | $176 | $290 |
| 2023 | $10,996 | $493 | $215 | $278 |
| 2022 | $10,996 | $466 | $176 | $290 |
| 2021 | $15,407 | $553 | $209 | $344 |
| 2020 | $13,813 | $914 | $436 | $478 |
| 2019 | $1,433 | $914 | $436 | $478 |
| 2018 | $9,855 | $914 | $0 | $0 |
| 2017 | $8,587 | $914 | $436 | $478 |
| 2016 | $9,908 | $914 | $436 | $478 |
| 2015 | $1,357 | $914 | $436 | $478 |
| 2014 | $1,357 | $914 | $436 | $478 |
| 2013 | $1,245 | $914 | $436 | $478 |
Source: Public Records
Map
Nearby Homes
- 292 Ocean Ave
- 6 Windsor Place
- 160 Rocklyn Ave
- 107 Melrose Ave
- 70 Denton Ave
- 142 Rocklyn Ave
- 463 Ocean Ave
- 263 Village Ave
- 59 Manor Rd
- 3 Hampton Rd
- 19 Plainfield Ave
- 39 Munson Place
- 35 Ryder Ave
- 65 Earle Ave
- 280 Atlantic Ave Unit 140
- 290 Atlantic Ave Unit 211
- 290 Atlantic Ave Unit 245
- 320 Atlantic Ave Unit D2
- 320 Atlantic Ave Unit B4
- 108 Earle Ave
- 61 Vincent Place Unit 2nd Floor
- 61 Vincent Place
- 57 Vincent Place
- 75 Vincent Place
- 40 Jarvis Place
- 44 Jarvis Place
- 53 Vincent Place
- 36 Jarvis Place
- 48 Jarvis Place
- 79 Vincent Place
- 68 Vincent Place
- 62 Vincent Place
- 32 Jarvis Place
- 52 Jarvis Place
- 72 Vincent Place
- 58 Vincent Place
- 49 Vincent Place
- 76 Vincent Place
- 30 Jarvis Place
- 54 Vincent Place