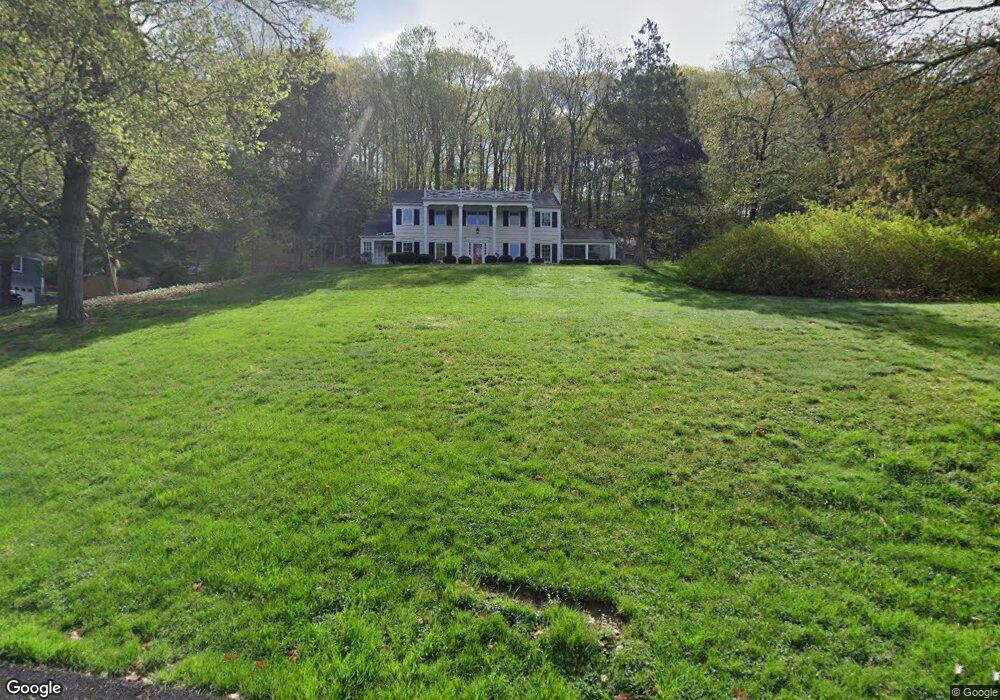
65 W Orchard Rd Chappaqua, NY 10514
Estimated Value: $1,345,663 - $1,680,000
4
Beds
3
Baths
2,966
Sq Ft
$519/Sq Ft
Est. Value
About This Home
This home is located at 65 W Orchard Rd, Chappaqua, NY 10514 and is currently estimated at $1,539,416, approximately $519 per square foot. 65 W Orchard Rd is a home located in Westchester County with nearby schools including Horace Greeley High School.
Ownership History
Date
Name
Owned For
Owner Type
Purchase Details
Closed on
Jun 29, 2010
Sold by
Young Andrew W and Young Stefanie S
Bought by
Weinberg Andrew C and Weinberg Susan
Current Estimated Value
Home Financials for this Owner
Home Financials are based on the most recent Mortgage that was taken out on this home.
Original Mortgage
$852,000
Outstanding Balance
$545,428
Interest Rate
4%
Mortgage Type
New Conventional
Estimated Equity
$993,988
Purchase Details
Closed on
Dec 20, 2001
Sold by
Genauer Emanuel
Bought by
Young Andrew W and Young Stefanie S
Home Financials for this Owner
Home Financials are based on the most recent Mortgage that was taken out on this home.
Original Mortgage
$275,000
Interest Rate
5.37%
Mortgage Type
Purchase Money Mortgage
Purchase Details
Closed on
Nov 12, 1995
Sold by
Genauer Emanuel and Genauer Ellen R
Bought by
Genauer Emanuel
Create a Home Valuation Report for This Property
The Home Valuation Report is an in-depth analysis detailing your home's value as well as a comparison with similar homes in the area
Home Values in the Area
Average Home Value in this Area
Purchase History
| Date | Buyer | Sale Price | Title Company |
|---|---|---|---|
| Weinberg Andrew C | $1,065,000 | Judicial Title Insurance | |
| Young Andrew W | $1,095,000 | The Judicial Title Ins Agenc | |
| Genauer Emanuel | -- | Commonwealth Land Title Ins |
Source: Public Records
Mortgage History
| Date | Status | Borrower | Loan Amount |
|---|---|---|---|
| Open | Weinberg Andrew C | $852,000 | |
| Previous Owner | Young Andrew W | $275,000 |
Source: Public Records
Tax History Compared to Growth
Tax History
| Year | Tax Paid | Tax Assessment Tax Assessment Total Assessment is a certain percentage of the fair market value that is determined by local assessors to be the total taxable value of land and additions on the property. | Land | Improvement |
|---|---|---|---|---|
| 2024 | $28,974 | $171,450 | $40,600 | $130,850 |
| 2023 | $28,330 | $171,450 | $40,600 | $130,850 |
| 2022 | $27,532 | $171,450 | $40,600 | $130,850 |
| 2021 | $27,223 | $171,450 | $40,600 | $130,850 |
| 2020 | $26,793 | $171,450 | $40,600 | $130,850 |
| 2019 | $110,387 | $171,450 | $40,600 | $130,850 |
| 2018 | $30,384 | $186,600 | $40,600 | $146,000 |
| 2017 | $7,570 | $186,600 | $40,600 | $146,000 |
| 2016 | $27,889 | $186,600 | $40,600 | $146,000 |
| 2015 | -- | $186,600 | $40,600 | $146,000 |
| 2014 | -- | $186,600 | $40,600 | $146,000 |
| 2013 | -- | $186,600 | $40,600 | $146,000 |
Source: Public Records
Map
Nearby Homes
- 35 Whitlaw Ln
- 550 Saw Mill River Rd
- 17 Ledgewood Commons
- 341 Millwood Rd
- 124 Seven Bridges Rd
- 111 Seven Bridges Rd
- 675 Quaker Rd
- 210 Seven Bridges Rd
- 18 Adams Rd
- 74 Pheasant Run Unit 74C
- 9 Possum Rd
- 6 Ichabod Ln
- 19 Stony Hollow
- 250 New York 100
- 35 Kerry Ln
- 62 Taconic Rd
- 10 Barnes Ln
- 181 Somerstown Rd
- 27 Deepwood Hill
- 1376 Spring Valley Rd