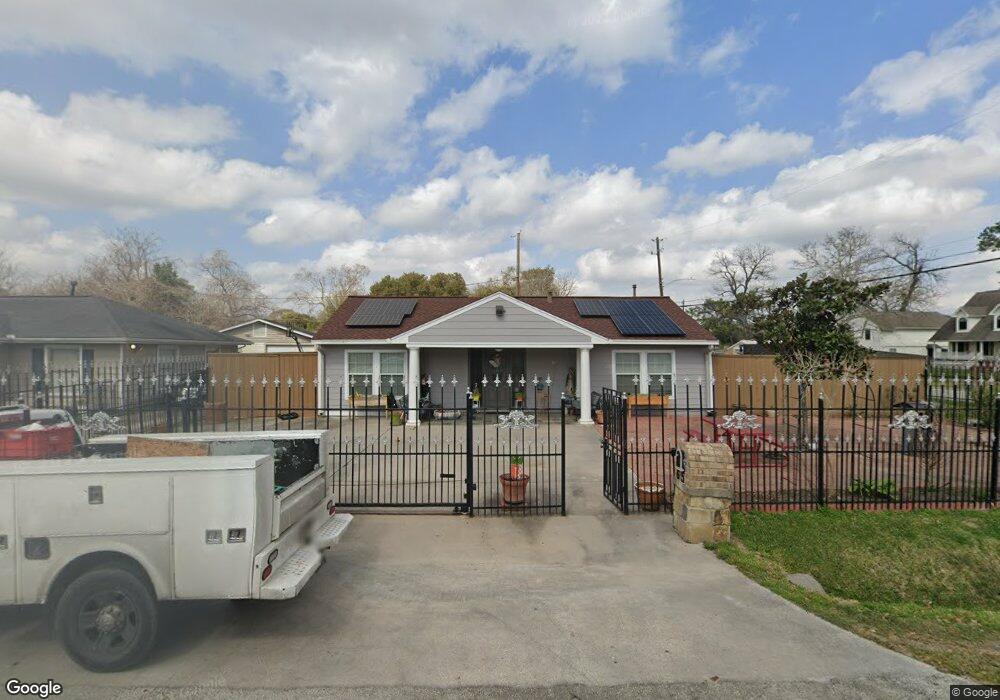
65 Wellford St Houston, TX 77022
Northside-Northline NeighborhoodEstimated Value: $220,000 - $254,922
2
Beds
2
Baths
1,067
Sq Ft
$224/Sq Ft
Est. Value
About This Home
This home is located at 65 Wellford St, Houston, TX 77022 and is currently estimated at $239,481, approximately $224 per square foot. 65 Wellford St is a home located in Harris County with nearby schools including Burbank Elementary School, Burbank Middle School, and Sam Houston Math, Science & Technology Center.
Ownership History
Date
Name
Owned For
Owner Type
Purchase Details
Closed on
Jan 28, 2012
Sold by
Chavez Evangelina and Barron Evangelina M
Bought by
The Evangelina M Barron Revocable Living and Barron Evangelina M
Current Estimated Value
Purchase Details
Closed on
Dec 1, 2011
Sold by
Chavez Julio
Bought by
Chavez Evangelina
Purchase Details
Closed on
Oct 10, 1999
Sold by
Martinez Francisco A and Martinez Isabel B
Bought by
Chavez Julio A and Chavez Evangelina M
Home Financials for this Owner
Home Financials are based on the most recent Mortgage that was taken out on this home.
Original Mortgage
$30,000
Outstanding Balance
$9,107
Interest Rate
7.9%
Mortgage Type
Seller Take Back
Estimated Equity
$230,374
Create a Home Valuation Report for This Property
The Home Valuation Report is an in-depth analysis detailing your home's value as well as a comparison with similar homes in the area
Home Values in the Area
Average Home Value in this Area
Purchase History
| Date | Buyer | Sale Price | Title Company |
|---|---|---|---|
| The Evangelina M Barron Revocable Living | -- | None Available | |
| Chavez Evangelina | -- | None Available | |
| Chavez Julio A | -- | -- |
Source: Public Records
Mortgage History
| Date | Status | Borrower | Loan Amount |
|---|---|---|---|
| Open | Chavez Julio A | $30,000 | |
| Closed | Chavez Julio A | $15,500 | |
| Closed | Chavez Evangelina | $0 |
Source: Public Records
Tax History Compared to Growth
Tax History
| Year | Tax Paid | Tax Assessment Tax Assessment Total Assessment is a certain percentage of the fair market value that is determined by local assessors to be the total taxable value of land and additions on the property. | Land | Improvement |
|---|---|---|---|---|
| 2025 | $8 | $230,986 | $73,322 | $157,664 |
| 2024 | $8 | $234,849 | $73,322 | $161,527 |
| 2023 | $8 | $211,347 | $73,322 | $138,025 |
| 2022 | $3,321 | $163,440 | $55,864 | $107,576 |
| 2021 | $3,196 | $154,639 | $55,864 | $98,775 |
| 2020 | $3,019 | $130,857 | $55,864 | $74,993 |
| 2019 | $2,868 | $113,334 | $36,661 | $76,673 |
| 2018 | $2,345 | $92,655 | $36,661 | $55,994 |
| 2017 | $2,343 | $92,655 | $36,661 | $55,994 |
| 2016 | $2,343 | $92,655 | $36,661 | $55,994 |
| 2015 | $2,342 | $91,090 | $36,661 | $54,429 |
| 2014 | $2,342 | $91,090 | $36,661 | $54,429 |
Source: Public Records
Map
Nearby Homes
- 56 Wellford St
- 45 Wellford St
- 61 Trenwood Ln
- 44 Farrell St
- 70 Burress St
- 90 Burress St Unit B
- 90 Burress St Unit A
- 108 Fichter St
- 132 Grothe Ln
- Cypress Plan at Wellford Village
- Willow Plan at Wellford Village
- 216 Burress St
- 119 Rebecca St
- 235 Julia St Unit B
- 249 De Boll St
- 131 Rebecca St
- 253 De Boll St
- 120 Rebecca St
- 240 Julia St Unit D
- 241 Rebecca St Unit A