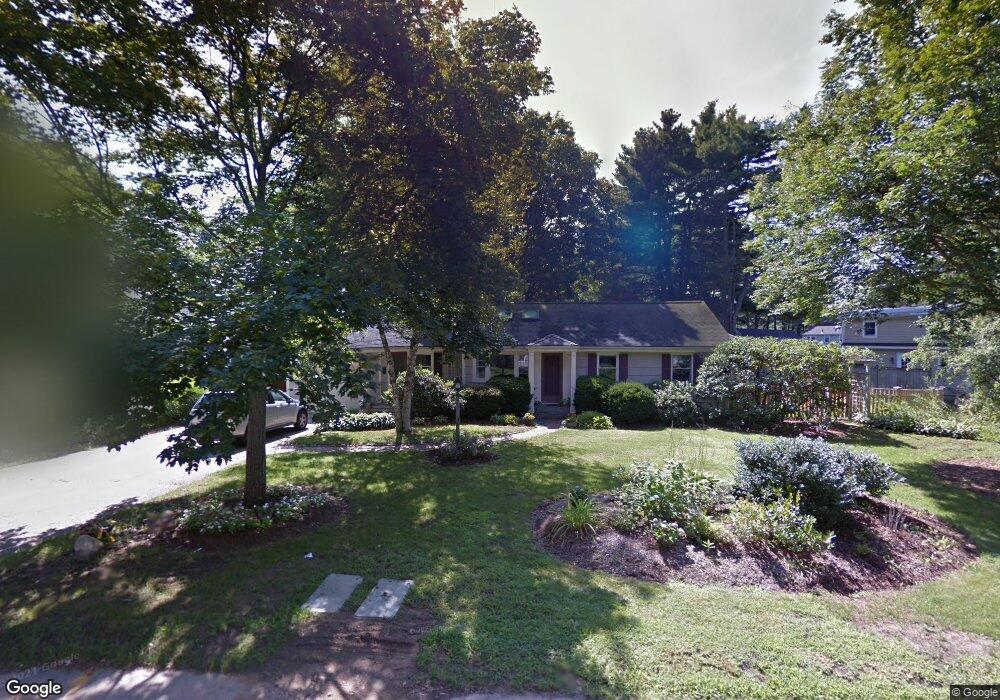
65 Whittemore St Concord, MA 01742
Estimated Value: $1,603,000 - $2,188,323
3
Beds
3
Baths
3,071
Sq Ft
$638/Sq Ft
Est. Value
About This Home
This home is located at 65 Whittemore St, Concord, MA 01742 and is currently estimated at $1,960,581, approximately $638 per square foot. 65 Whittemore St is a home located in Middlesex County with nearby schools including Willard School, Concord Middle School, and The Fenn School.
Ownership History
Date
Name
Owned For
Owner Type
Purchase Details
Closed on
Jan 21, 2021
Sold by
65 Whittemore Street Nt
Bought by
Wilson Thomas and Wilson Martha P
Current Estimated Value
Purchase Details
Closed on
Jul 22, 2015
Sold by
Soper Martha P
Bought by
65 Whittemore Street N
Purchase Details
Closed on
Jun 25, 2010
Sold by
Nelson Stephen and Nelson Marianne
Bought by
Soper Martha P
Home Financials for this Owner
Home Financials are based on the most recent Mortgage that was taken out on this home.
Original Mortgage
$365,500
Interest Rate
4.98%
Mortgage Type
Purchase Money Mortgage
Create a Home Valuation Report for This Property
The Home Valuation Report is an in-depth analysis detailing your home's value as well as a comparison with similar homes in the area
Home Values in the Area
Average Home Value in this Area
Purchase History
| Date | Buyer | Sale Price | Title Company |
|---|---|---|---|
| Wilson Thomas | -- | None Available | |
| 65 Whittemore Street N | -- | -- | |
| Soper Martha P | $665,500 | -- |
Source: Public Records
Mortgage History
| Date | Status | Borrower | Loan Amount |
|---|---|---|---|
| Previous Owner | Soper Martha P | $365,500 |
Source: Public Records
Tax History Compared to Growth
Tax History
| Year | Tax Paid | Tax Assessment Tax Assessment Total Assessment is a certain percentage of the fair market value that is determined by local assessors to be the total taxable value of land and additions on the property. | Land | Improvement |
|---|---|---|---|---|
| 2025 | $274 | $2,067,200 | $633,200 | $1,434,000 |
| 2024 | $27,184 | $2,070,400 | $633,200 | $1,437,200 |
| 2023 | $22,797 | $1,759,000 | $575,700 | $1,183,300 |
| 2022 | $21,765 | $1,474,600 | $460,500 | $1,014,100 |
| 2021 | $21,597 | $1,467,200 | $460,500 | $1,006,700 |
| 2020 | $20,356 | $1,430,500 | $460,500 | $970,000 |
| 2019 | $19,437 | $1,369,800 | $447,000 | $922,800 |
| 2018 | $18,208 | $1,274,200 | $425,700 | $848,500 |
| 2017 | $17,765 | $1,262,600 | $405,400 | $857,200 |
| 2016 | $5,877 | $422,167 | $405,400 | $16,767 |
| 2015 | $10,080 | $705,400 | $375,500 | $329,900 |
Source: Public Records
Map
Nearby Homes
- 84 Bruce Rd
- 232 Sudbury Rd
- 236 Fairhaven Rd
- 182 Southfield Rd
- 22 Belknap Ct
- 14 Thoreau St
- 143 Everett St
- 46 Sudbury Rd
- 602 Main St
- 181 Stow St
- 106 Elm St
- 46 Wood St
- 497 Old Road to 9 Acre Corner
- 61B Walden St
- 37 Wolf Pine Way
- 49 Willard Common
- 29 Willard Common
- 38-40 Court Ln
- 35 Chestnut St
- 29 Concord Greene Unit 3
- 51 Whittemore St
- 83 Whittemore St
- 115 Whittemore St
- 468 Sudbury Rd
- 66 Whittemore St
- 478 Sudbury Rd
- 458 Sudbury Rd
- 35 Whittemore St
- 54 Whittemore St
- 78 Whittemore St
- 448 Sudbury Rd
- 131 Whittemore St
- 96 Whittemore St
- 104 Whittemore St
- 86 Whittemore St
- 15 Whittemore St
- 32 Whittemore St
- 32 Whittemore St Unit 32
- 112 Whittemore St
- 467 Sudbury Rd