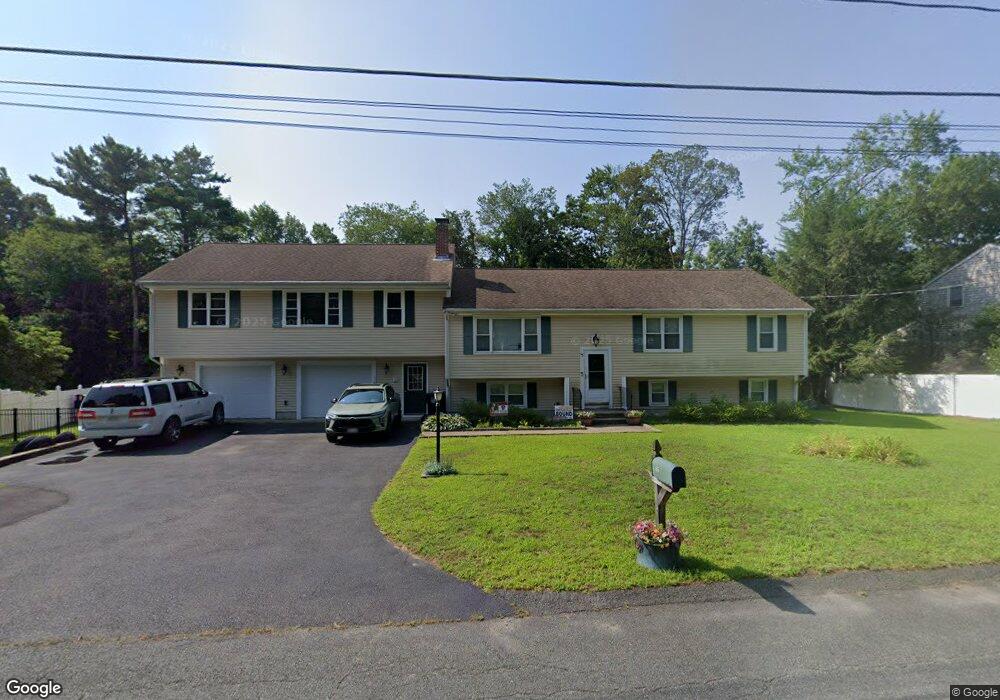
65 Windsor Dr Whitman, MA 02382
Estimated Value: $630,789 - $690,000
3
Beds
2
Baths
2,132
Sq Ft
$313/Sq Ft
Est. Value
About This Home
This home is located at 65 Windsor Dr, Whitman, MA 02382 and is currently estimated at $666,697, approximately $312 per square foot. 65 Windsor Dr is a home located in Plymouth County with nearby schools including Trinity Catholic Academy, Brockton Area Seventh-Day Adventist Academy, and Cardinal Spellman High School.
Ownership History
Date
Name
Owned For
Owner Type
Purchase Details
Closed on
Mar 9, 2010
Sold by
Sidman James and Sidman Donna
Bought by
Ennis Michael W and Ennis Stephanie M
Current Estimated Value
Home Financials for this Owner
Home Financials are based on the most recent Mortgage that was taken out on this home.
Original Mortgage
$294,566
Interest Rate
5.25%
Mortgage Type
FHA
Purchase Details
Closed on
Nov 1, 1999
Sold by
Ashmont William L and Ashmont Sandra A
Bought by
Perry Kyle and Perry Elain M
Home Financials for this Owner
Home Financials are based on the most recent Mortgage that was taken out on this home.
Original Mortgage
$138,350
Interest Rate
7.78%
Mortgage Type
Purchase Money Mortgage
Create a Home Valuation Report for This Property
The Home Valuation Report is an in-depth analysis detailing your home's value as well as a comparison with similar homes in the area
Home Values in the Area
Average Home Value in this Area
Purchase History
| Date | Buyer | Sale Price | Title Company |
|---|---|---|---|
| Ennis Michael W | $300,000 | -- | |
| Perry Kyle | $184,500 | -- |
Source: Public Records
Mortgage History
| Date | Status | Borrower | Loan Amount |
|---|---|---|---|
| Open | Perry Kyle | $299,081 | |
| Closed | Ennis Michael W | $294,566 | |
| Previous Owner | Perry Kyle | $165,000 | |
| Previous Owner | Perry Kyle | $138,350 | |
| Closed | Perry Kyle | $25,000 |
Source: Public Records
Tax History
| Year | Tax Paid | Tax Assessment Tax Assessment Total Assessment is a certain percentage of the fair market value that is determined by local assessors to be the total taxable value of land and additions on the property. | Land | Improvement |
|---|---|---|---|---|
| 2025 | $7,709 | $587,600 | $241,800 | $345,800 |
| 2024 | $6,680 | $524,300 | $237,500 | $286,800 |
| 2023 | $6,138 | $452,300 | $206,600 | $245,700 |
| 2022 | $6,028 | $414,000 | $187,500 | $226,500 |
| 2021 | $6,129 | $395,400 | $165,100 | $230,300 |
| 2020 | $5,888 | $371,500 | $156,600 | $214,900 |
| 2019 | $5,648 | $367,200 | $156,600 | $210,600 |
| 2018 | $5,367 | $335,200 | $143,800 | $191,400 |
| 2017 | $5,047 | $334,700 | $143,800 | $190,900 |
| 2016 | $4,925 | $315,900 | $138,500 | $177,400 |
| 2015 | $4,789 | $306,800 | $138,500 | $168,300 |
Source: Public Records
Map
Nearby Homes
Your Personal Tour Guide
Ask me questions while you tour the home.