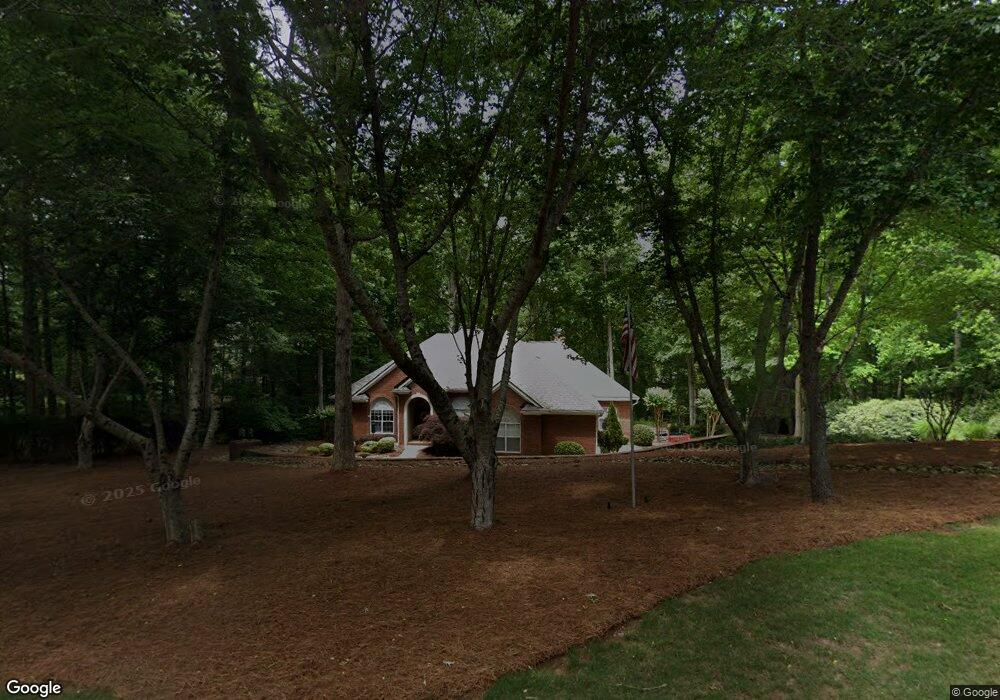
65 Woodcliff Ct Newnan, GA 30265
Arbor Springs Plantation NeighborhoodEstimated Value: $729,000 - $997,000
4
Beds
3
Baths
2,946
Sq Ft
$284/Sq Ft
Est. Value
About This Home
This home is located at 65 Woodcliff Ct, Newnan, GA 30265 and is currently estimated at $836,205, approximately $283 per square foot. 65 Woodcliff Ct is a home located in Coweta County with nearby schools including Arbor Springs Elementary School, Madras Middle School, and Northgate High School.
Ownership History
Date
Name
Owned For
Owner Type
Purchase Details
Closed on
May 18, 2020
Sold by
Miles Patrice G
Bought by
Miles Liv Trust
Current Estimated Value
Purchase Details
Closed on
Aug 6, 1998
Sold by
Stancole Corp
Bought by
Miles Patrice G and Miles Jesse C
Home Financials for this Owner
Home Financials are based on the most recent Mortgage that was taken out on this home.
Original Mortgage
$306,105
Interest Rate
7.12%
Mortgage Type
New Conventional
Purchase Details
Closed on
Oct 27, 1997
Sold by
Landward
Bought by
Stancole Corp
Home Financials for this Owner
Home Financials are based on the most recent Mortgage that was taken out on this home.
Original Mortgage
$238,400
Interest Rate
7.39%
Mortgage Type
New Conventional
Purchase Details
Closed on
May 21, 1991
Bought by
Landward Iii Inc
Purchase Details
Closed on
May 19, 1989
Bought by
Landward Iii Inc
Create a Home Valuation Report for This Property
The Home Valuation Report is an in-depth analysis detailing your home's value as well as a comparison with similar homes in the area
Home Values in the Area
Average Home Value in this Area
Purchase History
| Date | Buyer | Sale Price | Title Company |
|---|---|---|---|
| Miles Liv Trust | -- | -- | |
| Miles Patrice G | $307,700 | -- | |
| Stancole Corp | $35,100 | -- | |
| Landward Iii Inc | -- | -- | |
| Landward Iii Inc | -- | -- |
Source: Public Records
Mortgage History
| Date | Status | Borrower | Loan Amount |
|---|---|---|---|
| Previous Owner | Miles Patrice G | $306,105 | |
| Previous Owner | Stancole Corp | $238,400 |
Source: Public Records
Tax History Compared to Growth
Tax History
| Year | Tax Paid | Tax Assessment Tax Assessment Total Assessment is a certain percentage of the fair market value that is determined by local assessors to be the total taxable value of land and additions on the property. | Land | Improvement |
|---|---|---|---|---|
| 2025 | $6,536 | $325,679 | $68,000 | $257,679 |
| 2024 | $6,082 | $305,084 | $48,000 | $257,084 |
| 2023 | $6,082 | $302,462 | $48,000 | $254,462 |
| 2022 | $5,226 | $254,514 | $44,000 | $210,514 |
| 2021 | $4,960 | $230,830 | $44,000 | $186,830 |
| 2020 | $5,992 | $230,830 | $44,000 | $186,830 |
| 2019 | $5,818 | $203,583 | $38,000 | $165,583 |
| 2018 | $5,829 | $203,583 | $38,000 | $165,583 |
| 2017 | $5,827 | $203,583 | $38,000 | $165,583 |
| 2016 | $4,861 | $172,578 | $26,000 | $146,578 |
| 2015 | $4,782 | $172,578 | $26,000 | $146,578 |
| 2014 | $4,746 | $172,578 | $26,000 | $146,578 |
Source: Public Records
Map
Nearby Homes
- 84 Woodcliff Ct
- 15 Greenridge Way
- 320 Arbor Springs Plantation Dr
- 40 Arbor Springs Pkwy
- 53 Vinings Trace
- 45 Rose Arbor Ct
- 18 Rose Arbor Ct
- 44 S Arbor Shores
- 167 S Arbor Shores
- 75 Arbor Garden Cir
- 42 Cypress Trail
- 48 Fern Leaf Way
- 47 Fern Leaf Way
- 75 Primrose Pass
- 115 Primrose Pass
- 551 Arbor Springs Pkwy
- 177 Cranford Mill Dr
- 227 Sky View Ct
- 47 Sagewood Ct
- 277 Sky View Ct
- 55 Woodcliff Ct
- 97 Woodcliff Ct
- 50 Woodcliff Ct
- 70 Woodcliff Ct
- 70 Woodcliff Ct Unit 12A
- 29 Woodcliff Ct
- 94 Woodcliff Ct
- 105 Woodcliff Ct
- 96 Arbor Springs Plantation Dr
- 102 Woodcliff Ct
- 30 Woodcliff Ct
- 88 Arbor Springs Plantation Dr
- 114 Woodcliff Ct
- 125 Woodcliff Ct
- 11 Woodcliff Ct
- 91 Greenridge Way
- 91 Greenridge Way Unit 8A
- 99 Greenridge Way
- 139 Greenridge Way
- 14 Woodcliff Ct