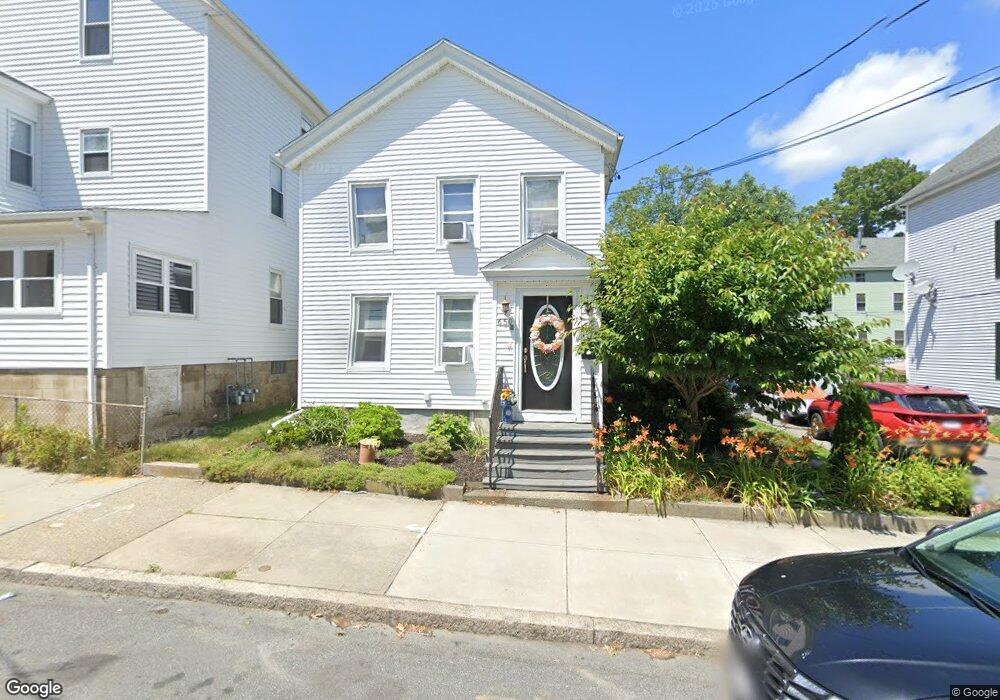
650 Cherry St Unit 2 Fall River, MA 02720
Bank Street NeighborhoodEstimated Value: $512,915 - $573,000
3
Beds
1
Bath
1,000
Sq Ft
$542/Sq Ft
Est. Value
About This Home
This home is located at 650 Cherry St Unit 2, Fall River, MA 02720 and is currently estimated at $541,979, approximately $541 per square foot. 650 Cherry St Unit 2 is a home located in Bristol County with nearby schools including Mary Fonseca Elementary School, Morton Middle School, and B M C Durfee High School.
Ownership History
Date
Name
Owned For
Owner Type
Purchase Details
Closed on
Jan 14, 2002
Sold by
Lapham Smith Rt
Bought by
Courchaine Diane and Courchaine Suzanne
Current Estimated Value
Home Financials for this Owner
Home Financials are based on the most recent Mortgage that was taken out on this home.
Original Mortgage
$116,000
Interest Rate
7.04%
Mortgage Type
Purchase Money Mortgage
Purchase Details
Closed on
Nov 28, 2001
Sold by
Lapham Smith Rt
Bought by
Aguiar Carlos M and Aguiar Isabel M
Home Financials for this Owner
Home Financials are based on the most recent Mortgage that was taken out on this home.
Original Mortgage
$116,000
Interest Rate
7.04%
Mortgage Type
Purchase Money Mortgage
Purchase Details
Closed on
Jul 23, 2001
Sold by
Halbardier Elizabeth and Powers Edwina P
Bought by
Lapham Smith Rt
Create a Home Valuation Report for This Property
The Home Valuation Report is an in-depth analysis detailing your home's value as well as a comparison with similar homes in the area
Home Values in the Area
Average Home Value in this Area
Purchase History
| Date | Buyer | Sale Price | Title Company |
|---|---|---|---|
| Courchaine Diane | $154,500 | -- | |
| Aguiar Carlos M | $148,000 | -- | |
| Lapham Smith Rt | $92,000 | -- |
Source: Public Records
Mortgage History
| Date | Status | Borrower | Loan Amount |
|---|---|---|---|
| Open | Lapham Smith Rt | $15,000 | |
| Open | Lapham Smith Rt | $150,000 | |
| Closed | Lapham Smith Rt | $116,000 |
Source: Public Records
Tax History
| Year | Tax Paid | Tax Assessment Tax Assessment Total Assessment is a certain percentage of the fair market value that is determined by local assessors to be the total taxable value of land and additions on the property. | Land | Improvement |
|---|---|---|---|---|
| 2025 | $5,352 | $467,400 | $119,200 | $348,200 |
| 2024 | $4,918 | $428,000 | $116,900 | $311,100 |
| 2023 | $5,644 | $460,000 | $105,300 | $354,700 |
| 2022 | $5,230 | $414,400 | $99,400 | $315,000 |
| 2021 | $4,698 | $339,700 | $94,900 | $244,800 |
| 2020 | $4,170 | $288,600 | $90,600 | $198,000 |
| 2019 | $4,063 | $278,700 | $94,700 | $184,000 |
| 2018 | $3,459 | $236,600 | $95,400 | $141,200 |
| 2017 | $3,283 | $234,500 | $95,400 | $139,100 |
| 2016 | $3,140 | $230,400 | $98,300 | $132,100 |
| 2015 | $3,014 | $230,400 | $98,300 | $132,100 |
| 2014 | $2,973 | $236,300 | $98,300 | $138,000 |
Source: Public Records
Map
Nearby Homes
Your Personal Tour Guide
Ask me questions while you tour the home.