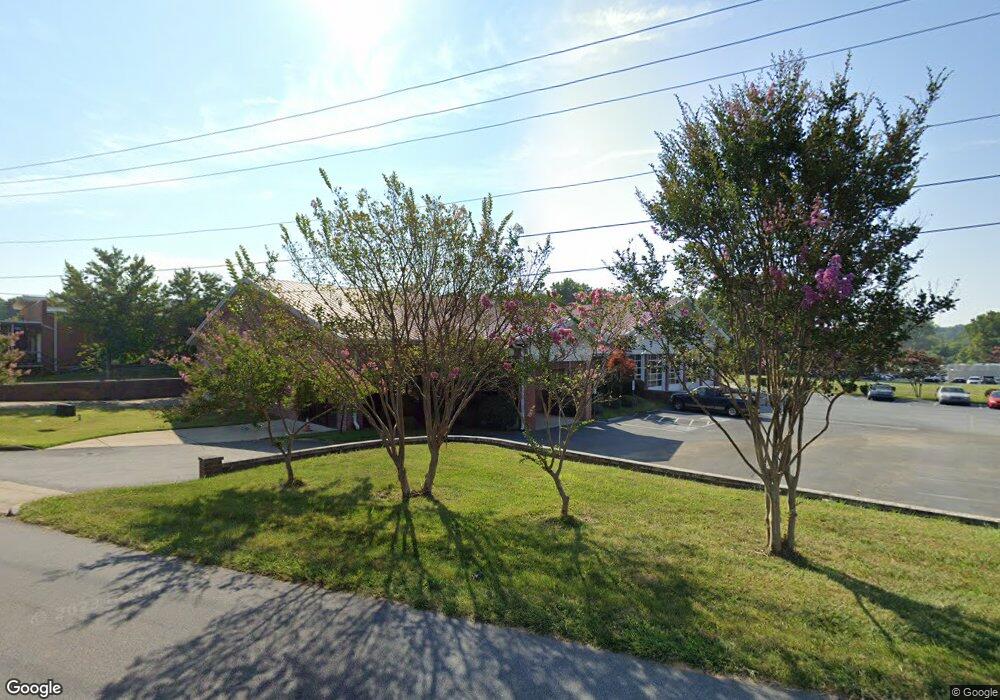
650 Concord Pkwy N Concord, NC 28027
Estimated Value: $2,260,149
--
Bed
--
Bath
12,872
Sq Ft
$176/Sq Ft
Est. Value
About This Home
This home is located at 650 Concord Pkwy N, Concord, NC 28027 and is currently estimated at $2,260,149, approximately $175 per square foot. 650 Concord Pkwy N is a home located in Cabarrus County with nearby schools including Winecoff Elementary School, Northwest Cabarrus Middle School, and The Daniel Academy of Concord.
Ownership History
Date
Name
Owned For
Owner Type
Purchase Details
Closed on
Oct 25, 2016
Sold by
Greenwich Investors Xlv Reo Llc
Bought by
Rowan Cabarrus Community College Board O
Current Estimated Value
Purchase Details
Closed on
Apr 12, 2016
Sold by
Taylor Olivia Properties Llc
Bought by
Xlv Reo Llc
Purchase Details
Closed on
Feb 7, 2011
Sold by
Carolina Radiator & Air Conditioning Sup
Bought by
Taylor Olivia Properties Llc
Purchase Details
Closed on
Jun 23, 2005
Sold by
Carolina Radiator & Air Conditioning Sup
Bought by
Taylor Olivia Llc
Home Financials for this Owner
Home Financials are based on the most recent Mortgage that was taken out on this home.
Original Mortgage
$1,140,000
Interest Rate
5.7%
Mortgage Type
Commercial
Create a Home Valuation Report for This Property
The Home Valuation Report is an in-depth analysis detailing your home's value as well as a comparison with similar homes in the area
Home Values in the Area
Average Home Value in this Area
Purchase History
| Date | Buyer | Sale Price | Title Company |
|---|---|---|---|
| Rowan Cabarrus Community College Board O | $1,050,000 | None Available | |
| Xlv Reo Llc | $1,250,000 | None Available | |
| Taylor Olivia Properties Llc | -- | None Available | |
| Taylor Olivia Llc | -- | -- |
Source: Public Records
Mortgage History
| Date | Status | Borrower | Loan Amount |
|---|---|---|---|
| Previous Owner | Taylor Olivia Llc | $1,140,000 |
Source: Public Records
Tax History Compared to Growth
Tax History
| Year | Tax Paid | Tax Assessment Tax Assessment Total Assessment is a certain percentage of the fair market value that is determined by local assessors to be the total taxable value of land and additions on the property. | Land | Improvement |
|---|---|---|---|---|
| 2025 | -- | $2,912,480 | $1,431,350 | $1,481,130 |
| 2024 | -- | $2,912,480 | $1,431,350 | $1,481,130 |
| 2023 | $0 | $2,015,050 | $795,190 | $1,219,860 |
| 2022 | $0 | $2,015,050 | $795,190 | $1,219,860 |
| 2021 | $0 | $2,015,050 | $795,190 | $1,219,860 |
| 2020 | $18,340 | $2,015,050 | $795,190 | $1,219,860 |
| 2019 | $18,340 | $1,554,220 | $616,110 | $938,110 |
| 2018 | $18,340 | $1,554,220 | $616,110 | $938,110 |
| 2017 | $18,340 | $1,554,220 | $616,110 | $938,110 |
| 2016 | -- | $1,394,930 | $453,020 | $941,910 |
| 2015 | -- | $1,394,930 | $453,020 | $941,910 |
| 2014 | -- | $1,394,930 | $453,020 | $941,910 |
Source: Public Records
Map
Nearby Homes
- 69 Lake Dr NW
- 636 Central Dr NW
- 604 Central Dr NW
- 520 Central Dr NW
- 205 Cliffwood St NW Unit A
- 205 Cliffwood St NW Unit C-3
- 225 Cliffwood St NW Unit B
- 225 Cliffwood St NW Unit 9
- 471 Lucky Dr NW
- 115 Red Bud Place NW
- 456 Lucky Dr NW
- 921 Concord Parkway Hwy N
- Roxbury Plan at Cannon Run
- 2567 Cornelius Place NW Unit 84
- 163 Crenshaw Place NW
- 480 Harris St NW
- 2574 Red Hill St NW
- 2574 Red Hill St NW Unit 62
- 528 Gibson Dr NW
- 452 Harris St NW
- 688 Hwy 29 N
- 688 Concord Pkwy N
- 688 Concord Pkwy N
- 240 Parkway Ave NW
- Lot 14 Concord Pkwy
- 234 Parkway Ave NW
- 701 Concord Pkwy N
- 230 Parkway Ave NW
- 415 Lizzie Ct NW
- 218 Parkway Ave NW
- 386 Lizzie Ct NW
- 386 Lizzie Ct NW
- 395 Lizzie Ct NW
- 390 Lizzie Ct NW
- 214 Parkway Ave NW
- 389 Lizzie Ct NW
- 212 Parkway Ave NW
- 216 Parkway Ave NW
- 362 Gurley Dr NW
- 376 Lizzie Ct NW