Estimated payment $2,207/month
About This Lot
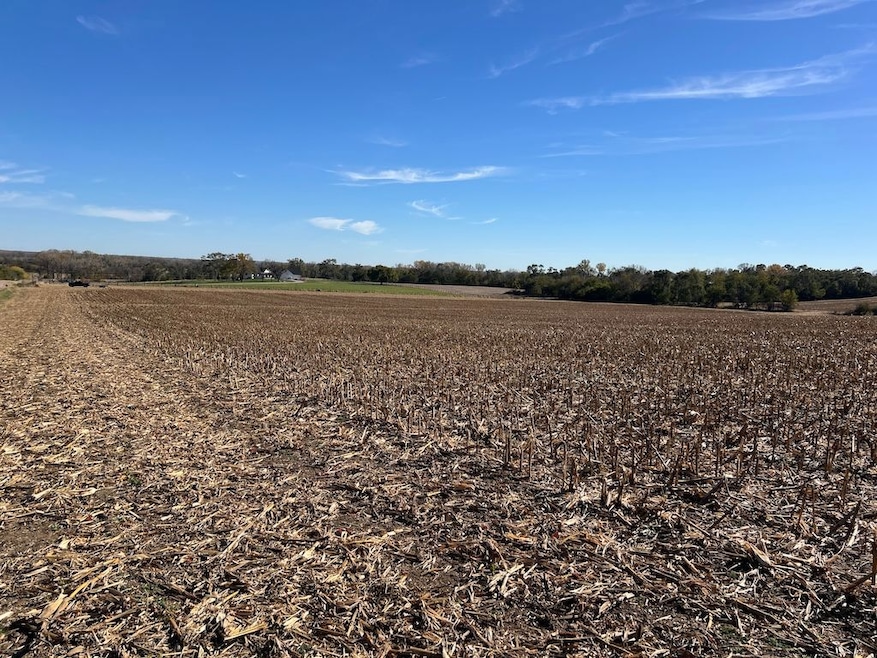
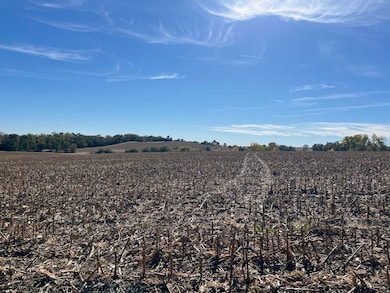
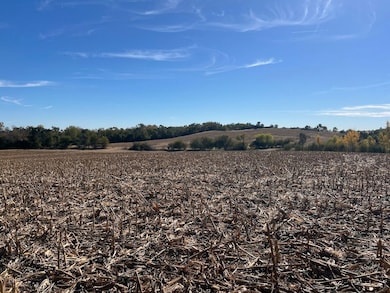
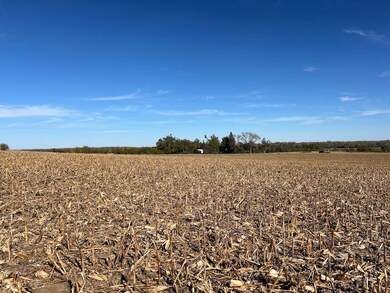
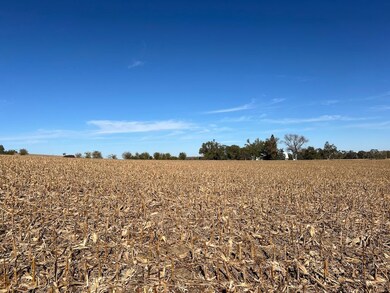
Enjoy acreage living just minutes away from West Omaha and northern Yutan. These large acreage parcels contain trees, views and water that most people search for when they want to build their dream home on a larger piece of land. And better yet, no covenants! Barndominium dreams are attainable here. Each parcel has unique features such as natural springs, expanding views over the river valley, treed boundaries, seclusion from your neighbor, and much more. No parcels are builder attached! Hunt whitetail deer and turkey on your own land! Raise chickens and 4 H animals, ride horses, build a giant garden, dig a pond, come get your hands dirty. Get back to the old days of living off your land! OPPD power will be available to each parcel. Private well and septic will be required. Approximate address for mapping purposes is 675 County Road R. Yutan, NE 68073

Property Details
Property Type
- Land
Est. Annual Taxes
- $3,351
Lot Details
- Current uses include agriculture
- Potential uses include hunting/fishing, residential single
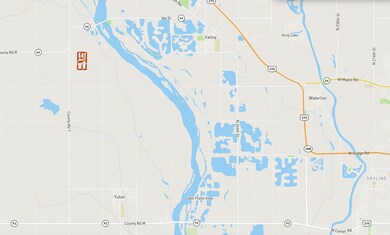
Map
Home Values in the Area
Average Home Value in this Area
Tax History
| Year | Tax Paid | Tax Assessment Tax Assessment Total Assessment is a certain percentage of the fair market value that is determined by local assessors to be the total taxable value of land and additions on the property. | Land | Improvement |
|---|---|---|---|---|
| 2024 | $3,351 | $330,675 | $85,460 | $245,215 |
| 2023 | $4,271 | $293,322 | $68,680 | $224,642 |
| 2022 | $3,964 | $263,592 | $68,680 | $194,912 |
| 2021 | $3,865 | $252,303 | $68,680 | $183,623 |
| 2020 | $3,792 | $245,502 | $68,680 | $176,822 |
| 2019 | $3,638 | $233,489 | $68,680 | $164,809 |
| 2018 | $3,594 | $227,150 | $68,680 | $158,470 |
| 2017 | $3,392 | $212,370 | $68,680 | $143,690 |
| 2016 | $3,378 | $212,370 | $68,680 | $143,690 |
| 2015 | $3,464 | $212,370 | $68,680 | $143,690 |
| 2014 | $3,038 | $184,820 | $58,510 | $126,310 |
| 2012 | $3,530 | $184,820 | $58,510 | $126,310 |
Property History
| Date | Event | Price | List to Sale | Price per Sq Ft |
|---|---|---|---|---|
| 11/11/2025 11/11/25 | For Sale | $645,000 | +73.9% | -- |
| 11/11/2025 11/11/25 | For Sale | $371,000 | +0.8% | -- |
| 11/11/2025 11/11/25 | For Sale | $368,000 | +0.8% | -- |
| 11/11/2025 11/11/25 | For Sale | $365,000 | -- | -- |
- County Road R
- Parcel 1 Spring Saunders County Acreages County Rd S
- Parcel 2 Spring Saunders County Acreages County Rd S
- Parcel 4 Spring Saunders County Acreages County Rd
- Parcel 3 Spring Saunders County Acreages County Rd
- Parcel 6 Spring Saunders County Acreages County Rd
- Parcel 5 Spring Saunders County Acreages County Rd
- 2 Ginger Cove Rd
- 846 Freedom Ridge Rd
- 6009 N 294th Cir
- 6408 N 293 Cir
- 5903 N 294th Cir
- 5306 N 290th Cir
- 5512 N 290 Cir
- 29203 Mary St
- 5411 N 290th Cir
- 29116 Laurel Cir
- 29110 Laurel Cir
- 29109 Mary St
- 29105 Mary St
- 7515 N 286th St
- 7307 N 279th St
- 2510 Campanile Rd
- 550 S Johnson Rd
- 1021 S Howard St
- 221 S Thomas St
- 3333 N 212th St
- 20939 Ellison Ave
- 2120 N Main St
- 1805 N 207th St
- 20862 T Plaza
- 1702 N 205th St
- 2302 N 204th St
- 19910 Lake Plaza
- 3535 Piney Creek Dr
- 19312 Grant Plaza
- 1818 S 204th St
- 1303-1403 S 203rd St
- 2600 Laverna St
- 2535 Laverna St