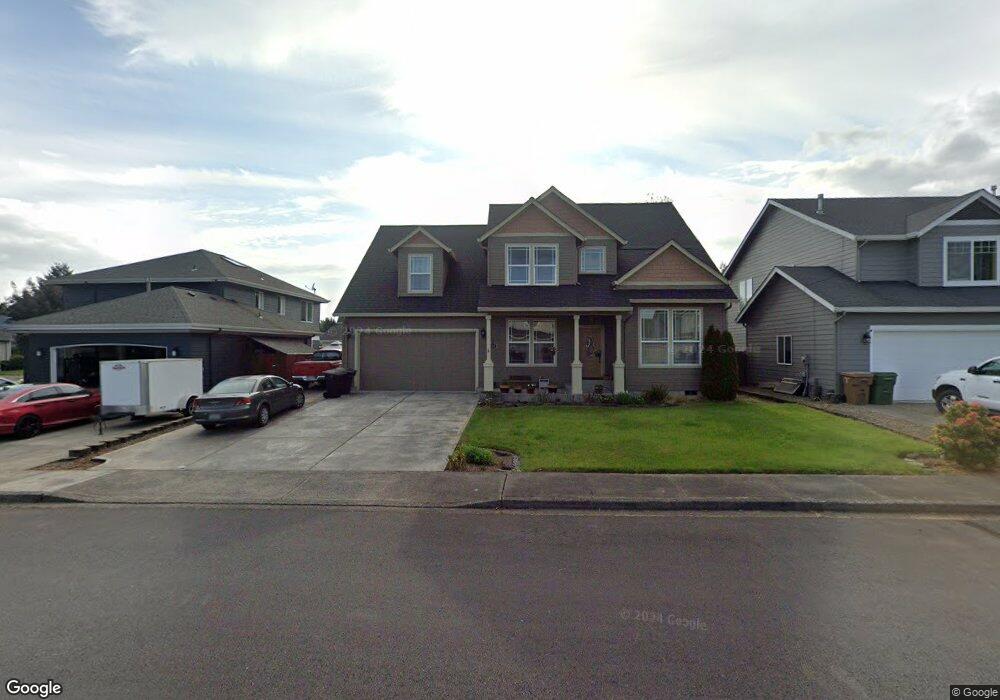
650 Embassy Loop Woodland, WA 98674
Estimated Value: $542,836 - $726,000
4
Beds
3
Baths
3,074
Sq Ft
$208/Sq Ft
Est. Value
About This Home
This home is located at 650 Embassy Loop, Woodland, WA 98674 and is currently estimated at $638,459, approximately $207 per square foot. 650 Embassy Loop is a home located in Cowlitz County with nearby schools including Woodland High School.
Ownership History
Date
Name
Owned For
Owner Type
Purchase Details
Closed on
Jan 13, 2010
Sold by
Hundley Jared S and Hundley Holly L
Bought by
Peterson Brian and Peterson Wendy
Current Estimated Value
Home Financials for this Owner
Home Financials are based on the most recent Mortgage that was taken out on this home.
Original Mortgage
$245,918
Outstanding Balance
$159,233
Interest Rate
4.68%
Mortgage Type
New Conventional
Estimated Equity
$479,226
Purchase Details
Closed on
Aug 28, 2007
Sold by
Glessing Brett and Glessing Jackie
Bought by
Hundley Jared S and Hundley Holly L
Home Financials for this Owner
Home Financials are based on the most recent Mortgage that was taken out on this home.
Original Mortgage
$329,000
Interest Rate
6.74%
Mortgage Type
Purchase Money Mortgage
Purchase Details
Closed on
Feb 24, 2005
Sold by
Williams Park Development Corp
Bought by
Glessings Bret and Glessing Jackie
Create a Home Valuation Report for This Property
The Home Valuation Report is an in-depth analysis detailing your home's value as well as a comparison with similar homes in the area
Home Values in the Area
Average Home Value in this Area
Purchase History
| Date | Buyer | Sale Price | Title Company |
|---|---|---|---|
| Peterson Brian | $241,000 | Chicago Title Ins Van | |
| Hundley Jared S | $329,000 | Chicago Title | |
| Glessings Bret | $53,257 | Stewart Title Of Wes |
Source: Public Records
Mortgage History
| Date | Status | Borrower | Loan Amount |
|---|---|---|---|
| Open | Peterson Brian | $245,918 | |
| Previous Owner | Hundley Jared S | $329,000 |
Source: Public Records
Tax History Compared to Growth
Tax History
| Year | Tax Paid | Tax Assessment Tax Assessment Total Assessment is a certain percentage of the fair market value that is determined by local assessors to be the total taxable value of land and additions on the property. | Land | Improvement |
|---|---|---|---|---|
| 2024 | $4,734 | $481,460 | $72,490 | $408,970 |
| 2023 | $4,413 | $469,920 | $72,490 | $397,430 |
| 2022 | $4,056 | $444,380 | $72,490 | $371,890 |
| 2021 | $4,387 | $384,340 | $65,900 | $318,440 |
| 2020 | $3,897 | $386,000 | $65,880 | $320,120 |
| 2019 | $3,349 | $337,166 | $65,880 | $271,286 |
| 2018 | $3,888 | $334,480 | $65,880 | $268,600 |
| 2017 | $3,256 | $334,480 | $65,880 | $268,600 |
| 2016 | $2,985 | $289,880 | $61,000 | $228,880 |
| 2015 | $2,996 | $261,090 | $61,000 | $200,090 |
| 2013 | -- | $227,790 | $54,760 | $173,030 |
Source: Public Records
Map
Nearby Homes
- 2216 Statesman Dr Unit Lot 46
- 2214 Statesman Dr Unit Lot 45
- 2210 Statesman Dr Unit 44
- 2220 Ash St Unit Lot 24
- 2271 Ash St Unit Lot 92
- 2233 Ash St Unit Lot 84
- 2229 Ash St Unit Lot 83
- 2257 Ash St Unit Lot 88
- 2245 Ash St Unit Lot 86
- 369 Gun Club Rd Unit 117
- 369 Gun Club Rd Unit 53
- 369 Gun Club Rd Unit 70
- 369 Gun Club Rd Unit 114
- 369 Gun Club Rd Unit 101
- 369 Gun Club Rd Unit 48
- 2249 Ash St Unit Lot 87
- 2211 Mccracken Rd Unit Lot 10
- 2248 Ash St Unit Lot 19
- 2231 Mccracken Rd Unit LOT 8
- 2243 Mccracken Rd Unit Lot 7
- 630 Embassy Loop
- 670 Embassy Loop
- 610 Embassy Loop
- 645 Embassy Loop
- 665 Embassy Loop
- 625 Embassy Loop
- 516 Embassy Loop
- 580 Embassy Loop
- 508 Embassy Loop
- 524 Embassy Loop
- 2070 Statesman Dr
- 2060 Statesman Dr
- 2080 Statesman Dr
- 615 Embassy Loop
- 534 Embassy Loop
- 2050 Statesman Dr
- 605 Embassy Loop
- 2090 Statesman Dr
- 597 Embassy Loop
- 595 Embassy Loop