Estimated Value: $470,514 - $510,000
5
Beds
3
Baths
3,084
Sq Ft
$160/Sq Ft
Est. Value
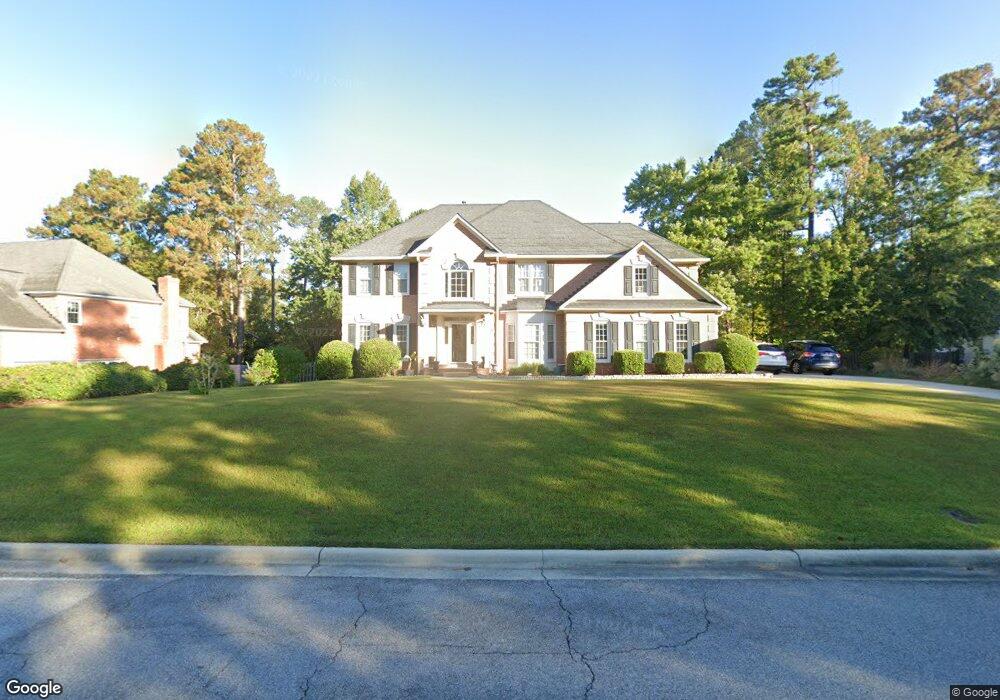
About This Home
This home is located at 650 Fieldstone Way, Evans, GA 30809 and is currently estimated at $494,879, approximately $160 per square foot. 650 Fieldstone Way is a home located in Columbia County with nearby schools including Northmore Elementary School, Tohopekaliga High School, and River Ridge Elementary School.
Ownership History
Date
Name
Owned For
Owner Type
Purchase Details
Closed on
Apr 1, 2011
Sold by
Humphries Hasek Ginger K
Bought by
Hasek Michael J
Current Estimated Value
Home Financials for this Owner
Home Financials are based on the most recent Mortgage that was taken out on this home.
Original Mortgage
$244,150
Outstanding Balance
$168,071
Interest Rate
4.83%
Mortgage Type
New Conventional
Estimated Equity
$326,808
Purchase Details
Closed on
Mar 31, 2011
Sold by
Erne Signe Alexis
Bought by
Humphries Hasek Ginger K
Home Financials for this Owner
Home Financials are based on the most recent Mortgage that was taken out on this home.
Original Mortgage
$244,150
Outstanding Balance
$168,071
Interest Rate
4.83%
Mortgage Type
New Conventional
Estimated Equity
$326,808
Purchase Details
Closed on
Mar 3, 2011
Sold by
Erne Signe Alexis
Bought by
Erne Signe Alexis
Home Financials for this Owner
Home Financials are based on the most recent Mortgage that was taken out on this home.
Original Mortgage
$244,150
Outstanding Balance
$168,071
Interest Rate
4.83%
Mortgage Type
New Conventional
Estimated Equity
$326,808
Create a Home Valuation Report for This Property
The Home Valuation Report is an in-depth analysis detailing your home's value as well as a comparison with similar homes in the area
Home Values in the Area
Average Home Value in this Area
Purchase History
| Date | Buyer | Sale Price | Title Company |
|---|---|---|---|
| Hasek Michael J | -- | -- | |
| Humphries Hasek Ginger K | $257,000 | -- | |
| Humphries Hasek Ginger K | $257,000 | -- | |
| Erne Signe Alexis | -- | -- |
Source: Public Records
Mortgage History
| Date | Status | Borrower | Loan Amount |
|---|---|---|---|
| Open | Humphries Hasek Ginger K | $244,150 | |
| Closed | Humphries Hasek Ginger K | $244,150 |
Source: Public Records
Tax History Compared to Growth
Tax History
| Year | Tax Paid | Tax Assessment Tax Assessment Total Assessment is a certain percentage of the fair market value that is determined by local assessors to be the total taxable value of land and additions on the property. | Land | Improvement |
|---|---|---|---|---|
| 2025 | $4,086 | $170,866 | $30,704 | $140,162 |
| 2024 | $4,511 | $180,207 | $35,504 | $144,703 |
| 2023 | $4,511 | $163,743 | $31,004 | $132,739 |
| 2022 | $3,912 | $150,285 | $29,004 | $121,281 |
| 2021 | $3,649 | $134,035 | $24,304 | $109,731 |
| 2020 | $3,591 | $129,198 | $24,304 | $104,894 |
| 2019 | $3,450 | $124,127 | $22,004 | $102,123 |
| 2018 | $3,348 | $120,038 | $21,604 | $98,434 |
| 2017 | $3,439 | $122,869 | $21,704 | $101,165 |
| 2016 | $3,074 | $113,889 | $20,880 | $93,009 |
| 2015 | $3,176 | $115,477 | $19,580 | $95,897 |
| 2014 | $3,121 | $112,014 | $19,680 | $92,334 |
Source: Public Records
Map
Nearby Homes
- 4489 Woodberry Ct
- 829 Woodberry Dr
- 854 Sparkleberry Rd
- 802 Sparkleberry Rd
- 800 Sparkleberry Rd
- 2975 Rosewood Dr
- 726 Whitney Shoals Rd
- 656 Deerwood Way
- 787 Springbrook Cir
- 322 Sandhills Ln
- 812 Cape Cod Ct
- 303 N Sandhills Ln
- 819 Cape Cod Ct
- 4614 Stoneridge Ct
- 4560 Mulberry Creek Dr
- 4670 La Pointe
- 646 Wellington Dr
- 34 Plantation Hills Dr
- 469 Lawrence Dr
- 839 Prairie Ln
- 652 Fieldstone Way
- 648 Fieldstone Way
- 4487 Sweet Gum Ct
- 647 Woodstone Ct
- 657 Fieldstone Way
- 4489 Sweet Gum Ct
- 828 Sparkleberry Rd
- 826 Sparkleberry Rd
- 637 Woodstone Way
- 824 Sparkleberry Rd
- 633 Woodstone Way
- 832 Sparkleberry Rd
- 639 Woodstone Way
- 655 Woodstone Ct
- 649 Woodstone Ct
- 4488 Sweet Gum Ct
- 631 Woodstone Way
- 4486 Sweet Gum Ct
- 834 Sparkleberry Rd
- 651 Woodstone Ct