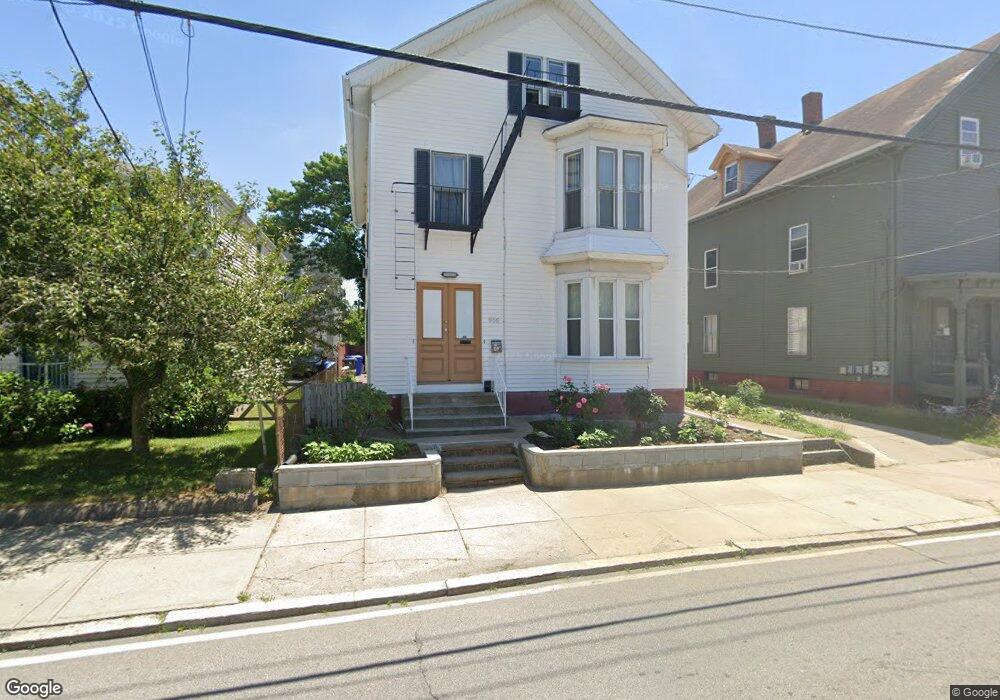
650 Main St Pawtucket, RI 02860
Downtown Pawtucket NeighborhoodEstimated Value: $479,121 - $622,000
5
Beds
2
Baths
2,092
Sq Ft
$253/Sq Ft
Est. Value
About This Home
This home is located at 650 Main St, Pawtucket, RI 02860 and is currently estimated at $529,780, approximately $253 per square foot. 650 Main St is a home located in Providence County with nearby schools including International Charter School, Blackstone Academy Charter School, and Saint Raphael Academy.
Ownership History
Date
Name
Owned For
Owner Type
Purchase Details
Closed on
Oct 12, 2021
Sold by
Camara Edward A and Camara Isabel
Bought by
Lobo Manuel
Current Estimated Value
Home Financials for this Owner
Home Financials are based on the most recent Mortgage that was taken out on this home.
Original Mortgage
$343,151
Outstanding Balance
$311,560
Interest Rate
2.8%
Mortgage Type
FHA
Estimated Equity
$218,220
Purchase Details
Closed on
Dec 11, 2008
Sold by
Wells Fargo Bk
Bought by
Camara Isabel and Camara Edward A
Home Financials for this Owner
Home Financials are based on the most recent Mortgage that was taken out on this home.
Original Mortgage
$52,000
Interest Rate
6.49%
Mortgage Type
Purchase Money Mortgage
Purchase Details
Closed on
Jun 11, 2008
Sold by
Lopez David
Bought by
Wells Fargo Bank Na
Purchase Details
Closed on
Jun 2, 2003
Sold by
Xavier Pedro G and Xavier Jacqueline R
Bought by
Lopez David and Yayvaty Phon
Purchase Details
Closed on
Oct 29, 1999
Sold by
Boyer Drigane J
Bought by
Xavier Pedro G and Xavier Jacquelino R
Create a Home Valuation Report for This Property
The Home Valuation Report is an in-depth analysis detailing your home's value as well as a comparison with similar homes in the area
Home Values in the Area
Average Home Value in this Area
Purchase History
| Date | Buyer | Sale Price | Title Company |
|---|---|---|---|
| Lobo Manuel | $355,000 | None Available | |
| Camara Isabel | $65,000 | -- | |
| Wells Fargo Bank Na | $207,368 | -- | |
| Lopez David | $190,000 | -- | |
| Xavier Pedro G | $83,000 | -- |
Source: Public Records
Mortgage History
| Date | Status | Borrower | Loan Amount |
|---|---|---|---|
| Open | Lobo Manuel | $343,151 | |
| Previous Owner | Xavier Pedro G | $52,000 | |
| Previous Owner | Xavier Pedro G | $260,950 |
Source: Public Records
Tax History
| Year | Tax Paid | Tax Assessment Tax Assessment Total Assessment is a certain percentage of the fair market value that is determined by local assessors to be the total taxable value of land and additions on the property. | Land | Improvement |
|---|---|---|---|---|
| 2025 | $4,854 | $369,100 | $54,600 | $314,500 |
| 2024 | $4,555 | $369,100 | $54,600 | $314,500 |
| 2023 | $3,935 | $232,300 | $33,700 | $198,600 |
| 2022 | $3,852 | $232,300 | $33,700 | $198,600 |
| 2021 | $3,852 | $232,300 | $33,700 | $198,600 |
| 2020 | $3,860 | $184,800 | $53,900 | $130,900 |
| 2019 | $3,860 | $184,800 | $53,900 | $130,900 |
| 2018 | $3,720 | $184,800 | $53,900 | $130,900 |
| 2017 | $3,631 | $159,800 | $55,600 | $104,200 |
| 2016 | $3,498 | $159,800 | $55,600 | $104,200 |
| 2015 | $3,498 | $159,800 | $55,600 | $104,200 |
| 2014 | $3,415 | $148,100 | $52,700 | $95,400 |
Source: Public Records
Map
Nearby Homes
Your Personal Tour Guide
Ask me questions while you tour the home.