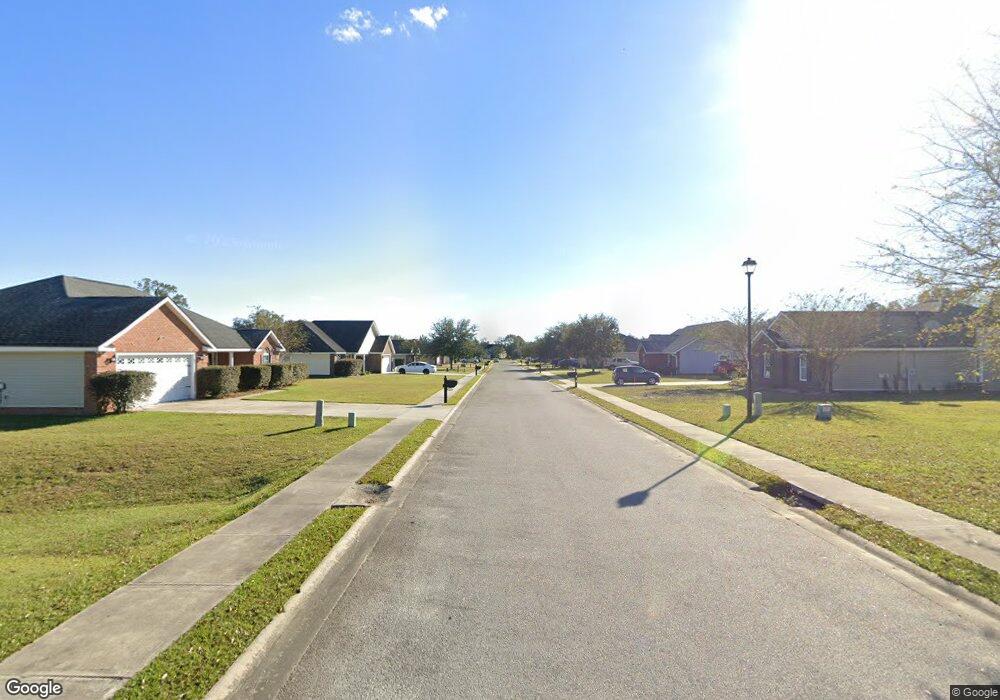
650 Mancey Garrason Loop Ludowici, GA 31316
Estimated Value: $228,000 - $259,000
3
Beds
2
Baths
1,410
Sq Ft
$175/Sq Ft
Est. Value
About This Home
This home is located at 650 Mancey Garrason Loop, Ludowici, GA 31316 and is currently estimated at $246,482, approximately $174 per square foot. 650 Mancey Garrason Loop is a home located in Long County with nearby schools including Smiley Elementary School, McClelland Elementary School, and Long County Middle School.
Ownership History
Date
Name
Owned For
Owner Type
Purchase Details
Closed on
Nov 6, 2023
Sold by
Teems Joshua Mark
Bought by
Buddy Rental Properties Llc
Current Estimated Value
Purchase Details
Closed on
Jan 18, 2019
Sold by
Milice Jean Daniel
Bought by
Teems Joshua Mark and Teems Kateland
Home Financials for this Owner
Home Financials are based on the most recent Mortgage that was taken out on this home.
Original Mortgage
$157,311
Interest Rate
4.6%
Purchase Details
Closed on
Jul 28, 2016
Sold by
Rakdham Berry
Bought by
Milice Jean Daniel
Home Financials for this Owner
Home Financials are based on the most recent Mortgage that was taken out on this home.
Original Mortgage
$141,988
Interest Rate
3.48%
Mortgage Type
VA
Purchase Details
Closed on
Nov 6, 2009
Sold by
Altamaha Equipment Co Inc
Bought by
J M Allen Construction Inc
Create a Home Valuation Report for This Property
The Home Valuation Report is an in-depth analysis detailing your home's value as well as a comparison with similar homes in the area
Home Values in the Area
Average Home Value in this Area
Purchase History
| Date | Buyer | Sale Price | Title Company |
|---|---|---|---|
| Buddy Rental Properties Llc | $180,000 | -- | |
| Teems Joshua Mark | $154,000 | -- | |
| Milice Jean Daniel | $139,000 | -- | |
| J M Allen Construction Inc | $19,600 | -- |
Source: Public Records
Mortgage History
| Date | Status | Borrower | Loan Amount |
|---|---|---|---|
| Previous Owner | Teems Joshua Mark | $157,311 | |
| Previous Owner | Milice Jean Daniel | $141,988 |
Source: Public Records
Tax History Compared to Growth
Tax History
| Year | Tax Paid | Tax Assessment Tax Assessment Total Assessment is a certain percentage of the fair market value that is determined by local assessors to be the total taxable value of land and additions on the property. | Land | Improvement |
|---|---|---|---|---|
| 2024 | $2,606 | $63,571 | $8,000 | $55,571 |
| 2023 | $2,204 | $63,571 | $8,000 | $55,571 |
| 2022 | $2,205 | $63,571 | $8,000 | $55,571 |
| 2021 | $1,963 | $57,222 | $8,000 | $49,222 |
| 2020 | $1,974 | $57,222 | $8,000 | $49,222 |
| 2019 | $1,974 | $57,222 | $8,000 | $49,222 |
| 2018 | $1,975 | $57,222 | $8,000 | $49,222 |
| 2017 | $1,924 | $57,222 | $8,000 | $49,222 |
| 2016 | $1,917 | $57,222 | $8,000 | $49,222 |
| 2015 | -- | $57,221 | $8,000 | $49,221 |
| 2014 | -- | $57,222 | $8,000 | $49,222 |
| 2013 | -- | $57,221 | $8,000 | $49,221 |
Source: Public Records
Map
Nearby Homes
- 97 Gracyn Ln NE
- 3.86 Smiley Rd NE
- 118 Pecan Dr NE
- 213 Timberland Dr NE
- 1 Rye Patch Ne Rd
- 22 Tower Rd
- 5930 Rye Patch Rd NE
- 400 Believers Ln NE
- 140 Cathy Rd NE
- 93 Loganberry Ln NE
- 246 Avondale Dr NE
- 14 Acres Smiley Rd
- 29 Covey Ln NE
- 46 Covey Ln NE
- 602 Hardee Rd NE
- 1197 Moody Rd NE
- 452 Hardee Rd
- 69 Morrison Way SE
- 75 Anna Way SE
- 168 Halcyon Way
- 650 Mancy Garrason Loop
- 632 Mancey Garrason Loop
- 668 Mancey Garrason Loop
- 663 Mancey Garrason Loop
- 641 Mancey Garrason Loop
- 606 Mancey Garrason Loop
- 677 Mancey Garrason Loop
- 623 Mancey Garrason Loop
- 603 Mancey Garrason Loop
- 584 Mancey Garrason Loop
- 579 Mancey Garrason Loop
- 37 Mancey Garrason Loop
- 55 Mancey Garrason Loop
- 23 Mancey Garrason Loop
- 566 Mancey Garrason Loop
- 77 Mancey Garrason Loop
- 58 Summerhill Dr NE
- 566 NE Mancey Garrason Loop
- 565 Mancey Garrason Loop
- 565 NE Mancey Garrason Loop