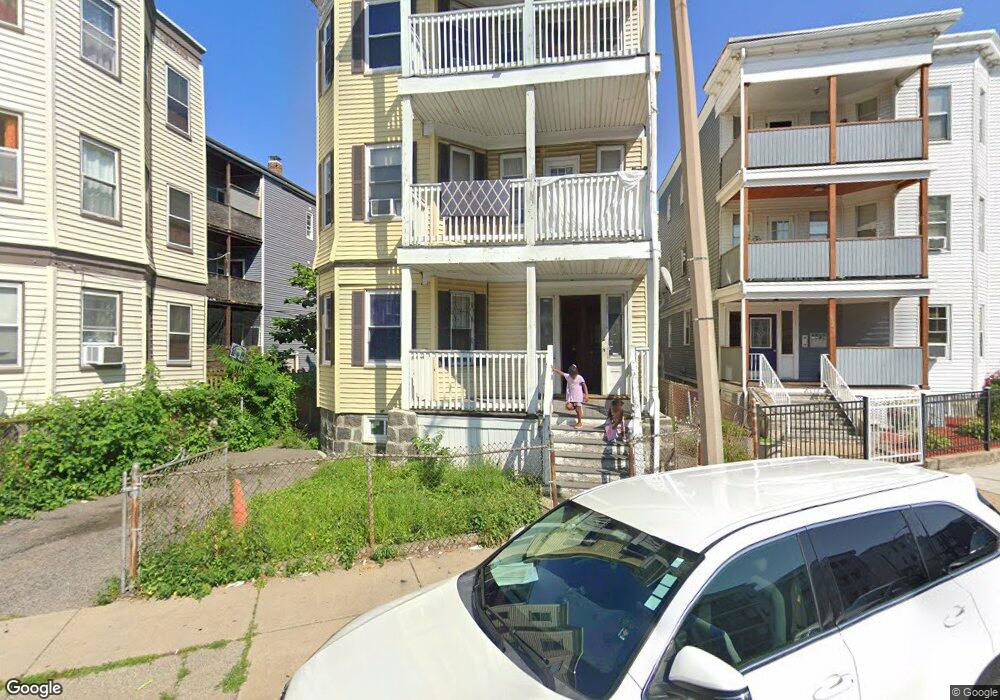
650 Morton St Unit 3 Mattapan, MA 02126
Franklin Field South NeighborhoodEstimated Value: $936,800 - $1,164,000
3
Beds
1
Bath
1,000
Sq Ft
$1,006/Sq Ft
Est. Value
About This Home
This home is located at 650 Morton St Unit 3, Mattapan, MA 02126 and is currently estimated at $1,005,950, approximately $1,005 per square foot. 650 Morton St Unit 3 is a home located in Suffolk County with nearby schools including KIPP Academy Boston Charter School and Berea Seventh-day Adventist Academy.
Ownership History
Date
Name
Owned For
Owner Type
Purchase Details
Closed on
Jun 5, 2002
Sold by
Herbert Theresa P
Bought by
Egwin Eugene
Current Estimated Value
Purchase Details
Closed on
Jul 14, 1997
Sold by
Burke Mary J
Bought by
Gallimore Peter
Create a Home Valuation Report for This Property
The Home Valuation Report is an in-depth analysis detailing your home's value as well as a comparison with similar homes in the area
Home Values in the Area
Average Home Value in this Area
Purchase History
| Date | Buyer | Sale Price | Title Company |
|---|---|---|---|
| Egwin Eugene | $340,000 | -- | |
| Gallimore Peter | $95,000 | -- |
Source: Public Records
Mortgage History
| Date | Status | Borrower | Loan Amount |
|---|---|---|---|
| Open | Gallimore Peter | $444,800 | |
| Closed | Gallimore Peter | $446,600 |
Source: Public Records
Tax History Compared to Growth
Tax History
| Year | Tax Paid | Tax Assessment Tax Assessment Total Assessment is a certain percentage of the fair market value that is determined by local assessors to be the total taxable value of land and additions on the property. | Land | Improvement |
|---|---|---|---|---|
| 2025 | $9,179 | $792,700 | $210,800 | $581,900 |
| 2024 | $7,823 | $717,700 | $172,100 | $545,600 |
| 2023 | $7,205 | $670,900 | $160,900 | $510,000 |
| 2022 | $6,693 | $615,200 | $147,500 | $467,700 |
| 2021 | $6,252 | $585,900 | $140,500 | $445,400 |
| 2020 | $5,249 | $497,100 | $157,300 | $339,800 |
| 2019 | $4,556 | $432,300 | $96,600 | $335,700 |
| 2018 | $3,938 | $375,800 | $96,600 | $279,200 |
| 2017 | $3,718 | $351,100 | $96,600 | $254,500 |
| 2016 | $3,358 | $305,300 | $96,600 | $208,700 |
| 2015 | $3,608 | $297,900 | $94,700 | $203,200 |
| 2014 | $3,258 | $259,000 | $94,700 | $164,300 |
Source: Public Records
Map
Nearby Homes
- 29 Havelock St
- 27 Havelock St
- 14 Estella St Unit 2
- 17 Greendale Rd Unit 2F
- 492 Harvard St
- 28 Hansborough St Unit 2
- 28 Hansborough St Unit 5
- 6 Deering Rd
- 30-32 Westmore Rd
- 21 Ashton St Unit 1
- 14 Fabyan St
- 69 Lucerne St
- 84 W Main St Unit 84
- 67 Wildwood St
- 1 Finch St Unit 1
- 4 Gilmer St
- 12 Finch St Unit 12
- 24 Marden Ave
- 44 Floyd St
- 10 Hosmer St
- 650 Morton St
- 652 Morton St
- 652 Morton St Unit 3
- 648 Morton St
- 648 Morton St
- 648 Morton St Unit 3
- 648 Morton St Unit 2
- 48 Havelock St
- 48 Havelock St Unit 2
- 48 Havelock St Unit 3
- 48 Havelock St Unit 1
- 44 Havelock St
- 646 Morton St
- 646 Morton St Unit 3
- 35 Baird St
- 35 Baird St Unit 2
- 40 Havelock St
- 660 Morton St
- 660 Morton St Unit 1
- 660 Morton St Unit 3