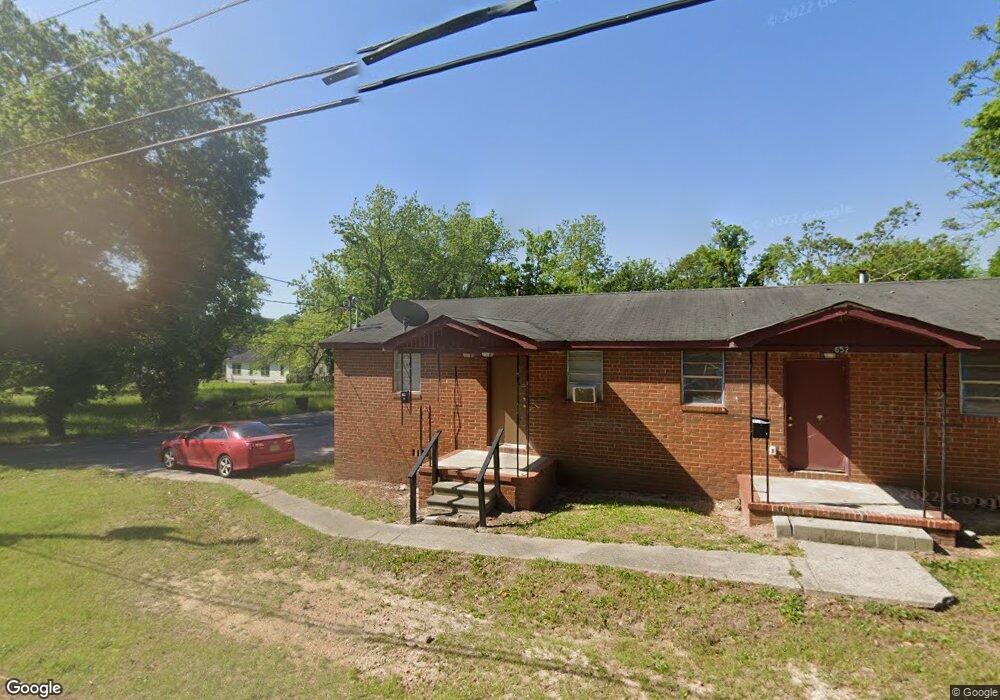
650 Pebble St Macon, GA 31201
Tindall Heights Historic District NeighborhoodEstimated Value: $82,000 - $186,000
4
Beds
2
Baths
1,300
Sq Ft
$97/Sq Ft
Est. Value
About This Home
This home is located at 650 Pebble St, Macon, GA 31201 and is currently estimated at $125,897, approximately $96 per square foot. 650 Pebble St is a home located in Bibb County with nearby schools including Ingram-Pye Elementary School and Central High School.
Ownership History
Date
Name
Owned For
Owner Type
Purchase Details
Closed on
Mar 22, 2021
Sold by
Cj Creative Llc
Bought by
Greenville Federal Credit Union
Current Estimated Value
Purchase Details
Closed on
Mar 18, 2021
Sold by
Cardona Felipa
Bought by
Gick Kathleen and Gick Grant Alan
Purchase Details
Closed on
Jul 10, 2019
Sold by
Clr Investment Group Llc
Bought by
Cj Creative Llc
Home Financials for this Owner
Home Financials are based on the most recent Mortgage that was taken out on this home.
Original Mortgage
$353,900
Interest Rate
3.9%
Mortgage Type
Future Advance Clause Open End Mortgage
Purchase Details
Closed on
Jul 21, 2017
Sold by
Flowers Ruth O
Bought by
Clr Investment Grroup Llc
Home Financials for this Owner
Home Financials are based on the most recent Mortgage that was taken out on this home.
Original Mortgage
$253,312
Interest Rate
3.89%
Mortgage Type
Unknown
Create a Home Valuation Report for This Property
The Home Valuation Report is an in-depth analysis detailing your home's value as well as a comparison with similar homes in the area
Home Values in the Area
Average Home Value in this Area
Purchase History
| Date | Buyer | Sale Price | Title Company |
|---|---|---|---|
| Greenville Federal Credit Union | -- | None Available | |
| Gick Kathleen | -- | None Available | |
| Cardona Felipa | $410,000 | None Available | |
| Cj Creative Llc | $382,690 | None Available | |
| Clr Investment Grroup Llc | $305,000 | None Available |
Source: Public Records
Mortgage History
| Date | Status | Borrower | Loan Amount |
|---|---|---|---|
| Previous Owner | Cj Creative Llc | $353,900 | |
| Previous Owner | Clr Investment Grroup Llc | $253,312 |
Source: Public Records
Tax History
| Year | Tax Paid | Tax Assessment Tax Assessment Total Assessment is a certain percentage of the fair market value that is determined by local assessors to be the total taxable value of land and additions on the property. | Land | Improvement |
|---|---|---|---|---|
| 2025 | $683 | $27,807 | $3,080 | $24,727 |
| 2024 | $713 | $28,087 | $3,360 | $24,727 |
| 2023 | $642 | $25,279 | $2,800 | $22,479 |
| 2022 | $906 | $26,183 | $4,121 | $22,062 |
| 2021 | $855 | $22,507 | $4,121 | $18,386 |
| 2020 | $768 | $19,783 | $4,121 | $15,662 |
| 2019 | $373 | $9,535 | $2,638 | $6,897 |
| 2018 | $932 | $9,535 | $2,638 | $6,897 |
| 2017 | $357 | $9,535 | $2,638 | $6,897 |
| 2016 | $330 | $9,534 | $2,638 | $6,897 |
| 2015 | $467 | $9,534 | $2,638 | $6,897 |
| 2014 | $537 | $9,534 | $2,638 | $6,897 |
Source: Public Records
Map
Nearby Homes
- 727 S Williams St
- 835 Elizabeth St
- 510 Edgewood Ave
- 453 Violet Ave
- 1835 Houston Ave
- 1590 Telfair St
- 1475 3rd St
- 836 Plant St
- 1405 2nd St
- 854 Plant St
- 1425 3rd St
- 542 Elm St
- 863 Edgewood Ave
- 1083 Elm St
- 1471 Jackson St
- 871 Tenney Ave
- 858 Tenney Ave
- 2221 Knott Street Ln
- 1335 Jackson St
- 1278 Jackson St
Your Personal Tour Guide
Ask me questions while you tour the home.