Estimated Value: $94,000 - $145,000
2
Beds
1
Bath
852
Sq Ft
$136/Sq Ft
Est. Value
About This Home
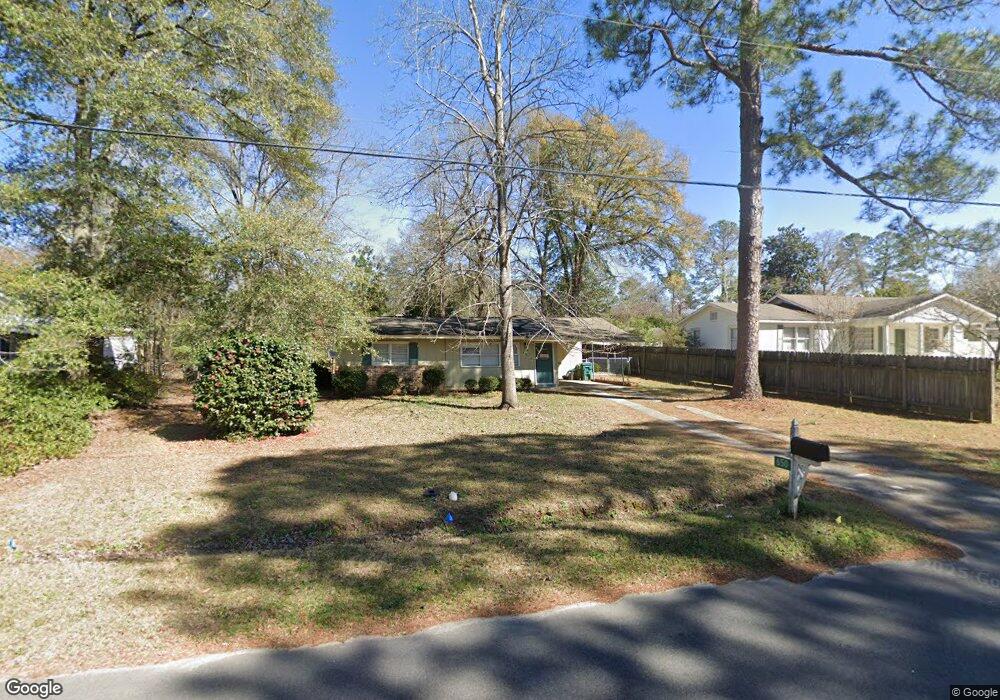
This home is located at 650 Pine Ridge St, Perry, GA 31069 and is currently estimated at $116,261, approximately $136 per square foot. 650 Pine Ridge St is a home located in Houston County with nearby schools including Tucker Elementary School, Perry Middle School, and Perry High School.
Ownership History
Date
Name
Owned For
Owner Type
Purchase Details
Closed on
Jun 22, 1990
Sold by
Richardson Mary P
Bought by
Shelton Charles Irby and Wynelle T*
Current Estimated Value
Purchase Details
Closed on
May 23, 1983
Sold by
Richardson Stewart S
Bought by
Richardson Mary P
Purchase Details
Closed on
May 14, 1975
Sold by
Burnett James H
Bought by
Richardson Mary P and Stewart S*
Purchase Details
Closed on
Feb 27, 1974
Sold by
Secretary Of Housing & Urban Dev
Bought by
Burnett James H
Purchase Details
Closed on
Mar 30, 1972
Sold by
Burnette Tinnie E
Bought by
Secretary Of Housing & Urban Dev
Purchase Details
Closed on
Dec 22, 1969
Sold by
Clark Margaret T
Bought by
Burnette Tinnie E
Purchase Details
Closed on
Aug 27, 1969
Sold by
Myers Margie P
Bought by
Clark Margaret T
Purchase Details
Closed on
Nov 28, 1966
Sold by
Brown Robert H
Bought by
Myers Margie P
Purchase Details
Closed on
Sep 29, 1962
Bought by
Brown Robert H
Create a Home Valuation Report for This Property
The Home Valuation Report is an in-depth analysis detailing your home's value as well as a comparison with similar homes in the area
Home Values in the Area
Average Home Value in this Area
Purchase History
| Date | Buyer | Sale Price | Title Company |
|---|---|---|---|
| Shelton Charles Irby | -- | -- | |
| Richardson Mary P | -- | -- | |
| Richardson Mary P | -- | -- | |
| Burnett James H | -- | -- | |
| Secretary Of Housing & Urban Dev | -- | -- | |
| Burnette Tinnie E | -- | -- | |
| Clark Margaret T | -- | -- | |
| Myers Margie P | -- | -- | |
| Brown Robert H | -- | -- |
Source: Public Records
Tax History Compared to Growth
Tax History
| Year | Tax Paid | Tax Assessment Tax Assessment Total Assessment is a certain percentage of the fair market value that is determined by local assessors to be the total taxable value of land and additions on the property. | Land | Improvement |
|---|---|---|---|---|
| 2024 | $1,066 | $29,000 | $6,040 | $22,960 |
| 2023 | $922 | $24,920 | $6,040 | $18,880 |
| 2022 | $530 | $23,040 | $6,040 | $17,000 |
| 2021 | $484 | $20,920 | $6,040 | $14,880 |
| 2020 | $474 | $20,400 | $6,040 | $14,360 |
| 2019 | $474 | $20,400 | $6,040 | $14,360 |
| 2018 | $474 | $20,400 | $6,040 | $14,360 |
| 2017 | $474 | $20,400 | $6,040 | $14,360 |
| 2016 | $475 | $20,400 | $6,040 | $14,360 |
| 2015 | $476 | $20,400 | $6,040 | $14,360 |
| 2014 | -- | $20,400 | $6,040 | $14,360 |
| 2013 | -- | $20,400 | $6,040 | $14,360 |
Source: Public Records
Map
Nearby Homes
- 706 Hillcrest Ave
- 625 Cooper St
- 630 Pine Ridge St
- 624 Pine Ridge St
- 903 Massee Ln
- 905 Massee Ln
- 1207 Tucker Rd
- 1406 Main St
- 1432 Duncan Ave
- 1438 Elizabeth Ave
- 0 Carroll Aly
- 1212 Swift St
- 1207 Swift St
- 1405 Cambridge Rd
- 1152 Lovely Ln
- 606 Frank Satterfield Rd
- 113 Pridgen Pass
- 117 Constance Ct
- 1808 Ross St
- 104 Pridgen Pass
- 652 Pine Ridge St
- 648 Pine Ridge St
- 637 Hillcrest Ave
- 635 Hillcrest Ave
- 646 Pine Ridge St
- 700 Pine Ridge St
- 1302 Duncan Ave
- 633 Hillcrest Ave
- 633 Pine Ridge St
- 633 Pineridge Dr #3`
- 633 Pineridge Drive #3
- 633 Pine Ridge Dr #1
- 633 Pineridge #5
- 633 Pineridge Dr #2
- 633 Pineridge Dr #5
- 633 Pineridge Drive #1
- 633 Pineridge Dr #1
- 633 Pineridge #2
- 633 Pineridge Dr #3
- 633 Pineridge Dr #6