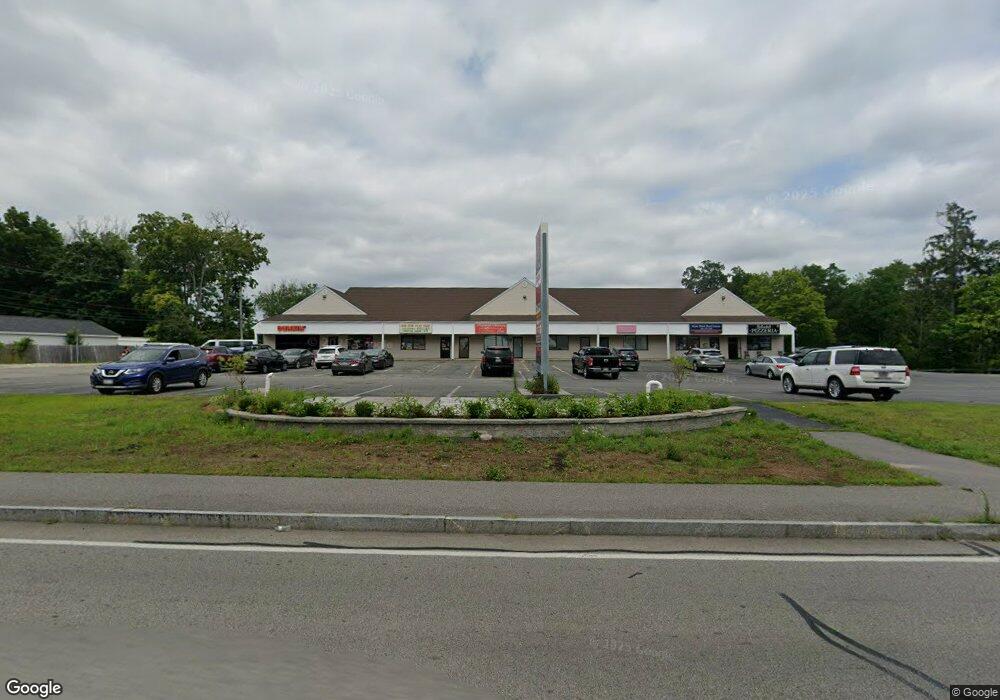
650 Plymouth St Unit 11 East Bridgewater, MA 02333
Estimated Value: $1,559,442
--
Bed
1
Bath
980
Sq Ft
$1,591/Sq Ft
Est. Value
About This Home
This home is located at 650 Plymouth St Unit 11, East Bridgewater, MA 02333 and is currently estimated at $1,559,442, approximately $1,591 per square foot. 650 Plymouth St Unit 11 is a home located in Plymouth County with nearby schools including Central Elementary School, Gordon W Mitchell Middle School, and East Bridgewater Jr./Sr. High School.
Ownership History
Date
Name
Owned For
Owner Type
Purchase Details
Closed on
Jan 20, 2017
Sold by
Brendini Rt
Bought by
Brendini Llc
Current Estimated Value
Purchase Details
Closed on
Apr 11, 2007
Sold by
Hilltop Realty Corp
Bought by
Brendini Rt
Purchase Details
Closed on
Jul 8, 1998
Sold by
John-Ali Rt and Comeau Allan A
Bought by
Jlm Services Corp
Purchase Details
Closed on
Nov 1, 1993
Sold by
Weymouth Sb
Bought by
Ferbert Theresa
Purchase Details
Closed on
Jun 5, 1991
Sold by
Keal Excavating Co Inc
Bought by
Waymouth Sb
Purchase Details
Closed on
Jan 22, 1988
Sold by
John-Ali Rt
Bought by
Keal Excavating Co
Create a Home Valuation Report for This Property
The Home Valuation Report is an in-depth analysis detailing your home's value as well as a comparison with similar homes in the area
Home Values in the Area
Average Home Value in this Area
Purchase History
| Date | Buyer | Sale Price | Title Company |
|---|---|---|---|
| Brendini Llc | -- | -- | |
| Brendini Rt | $784,751 | -- | |
| Jlm Services Corp | $500,000 | -- | |
| Ferbert Theresa | $95,000 | -- | |
| Waymouth Sb | $300,000 | -- | |
| Keal Excavating Co | $400,000 | -- |
Source: Public Records
Mortgage History
| Date | Status | Borrower | Loan Amount |
|---|---|---|---|
| Previous Owner | Keal Excavating Co | $250,000 | |
| Previous Owner | Keal Excavating Co | $900,000 |
Source: Public Records
Tax History Compared to Growth
Tax History
| Year | Tax Paid | Tax Assessment Tax Assessment Total Assessment is a certain percentage of the fair market value that is determined by local assessors to be the total taxable value of land and additions on the property. | Land | Improvement |
|---|---|---|---|---|
| 2025 | $27,895 | $2,040,600 | $335,200 | $1,705,400 |
| 2024 | $27,427 | $1,981,700 | $322,300 | $1,659,400 |
| 2023 | $26,350 | $1,823,500 | $298,400 | $1,525,100 |
| 2022 | $27,152 | $1,740,500 | $288,300 | $1,452,200 |
| 2021 | $29,000 | $1,700,900 | $279,900 | $1,421,000 |
| 2020 | $29,187 | $1,688,100 | $294,900 | $1,393,200 |
| 2019 | $29,058 | $1,654,800 | $289,200 | $1,365,600 |
| 2018 | $29,374 | $1,635,500 | $289,200 | $1,346,300 |
| 2017 | $28,771 | $1,572,200 | $277,900 | $1,294,300 |
| 2016 | $28,028 | $1,543,400 | $272,200 | $1,271,200 |
| 2015 | $27,468 | $1,546,600 | $270,400 | $1,276,200 |
| 2014 | $26,408 | $1,520,300 | $264,700 | $1,255,600 |
Source: Public Records
Map
Nearby Homes
- 121 South St
- 587 Bridge St
- 10 Eliab Latham Way
- 261 Plymouth St
- 28 Brookbend Way E
- 78 Crystal Water Dr
- 182 Crystal Water Dr Unit 182
- 217 Crystal Water Dr
- 0 Three Rivers Dr
- 590 Bedford St
- 386 Bedford St
- 71 Stonegate Dr
- 94 Pond St
- 391 Bedford St
- 71 Church St
- 23 Stone Meadow Dr
- 1993 Washington St
- 52 Cottage St
- 2045 Washington St
- 114 Plain St
- 650 Plymouth St
- 622 Plymouth St
- 622 Plymouth St Unit 2
- 680 Plymouth St
- 600 Plymouth St
- 617 Plymouth St
- 603 Plymouth St
- 25 South St
- 1 Wainor Terrace
- 584 Plymouth St
- 709 Plymouth St
- 587 Plymouth St
- 612 Plymouth St Unit 6
- 612 Plymouth St Unit 8
- 612 Plymouth St Unit 5
- 612 Plymouth St Unit 9
- 45 South St
- 555 Plymouth St
- 728 Plymouth St
- 50 Careys Landing