
Seller's Agent in 2016
Michelle O'mara
MAssachusetts Real Estate Group
(508) 254-2819
5 in this area
21 Total Sales


Estimated Value: $549,000 - $627,000
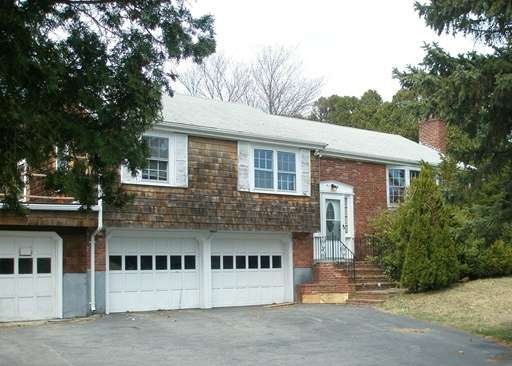
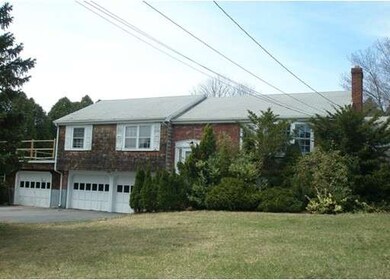
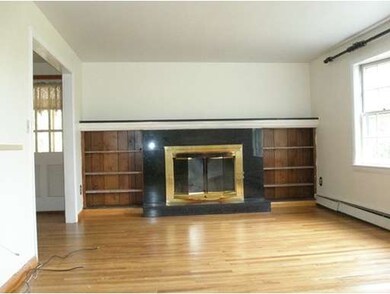
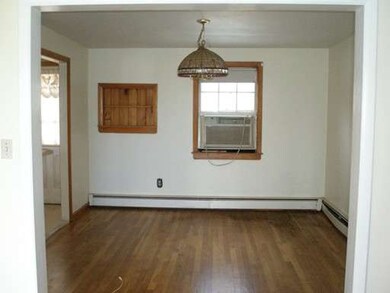
Oversized 3 BR split - 2,000 + of living area with some updates such as kitchen with granite countertops and tile. Hardwoods in family room, dining room and all bedrooms. Upstairs bathrooms with tile and granite. Partially finished lower level. Sunroom and yard area for relaxation! May need renovation type lending.
Last Agent to Sell the Property
MAssachusetts Real Estate Group Listed on: 05/05/2015
| Date | Buyer | Sale Price | Title Company |
|---|---|---|---|
| Lam Kenny | $330,000 | -- | |
| Ajemian Patricia | $142,500 | -- | |
| Ajemian Patricia | $142,500 | -- |
| Date | Status | Borrower | Loan Amount |
|---|---|---|---|
| Open | Ajemian Patricia | $255,480 | |
| Closed | Lam Kenny | $264,000 | |
| Closed | Lam Kenny | $32,900 | |
| Previous Owner | Ajemian Patricia | $16,135 |
| Date | Event | Price | List to Sale | Price per Sq Ft |
|---|---|---|---|---|
| 06/03/2016 06/03/16 | Sold | $200,000 | -11.1% | $83 / Sq Ft |
| 03/07/2016 03/07/16 | Pending | -- | -- | -- |
| 09/09/2015 09/09/15 | Price Changed | $225,000 | -3.0% | $93 / Sq Ft |
| 07/15/2015 07/15/15 | Price Changed | $232,000 | -11.5% | $96 / Sq Ft |
| 05/05/2015 05/05/15 | For Sale | $262,000 | -- | $108 / Sq Ft |
| Year | Tax Paid | Tax Assessment Tax Assessment Total Assessment is a certain percentage of the fair market value that is determined by local assessors to be the total taxable value of land and additions on the property. | Land | Improvement |
|---|---|---|---|---|
| 2025 | $5,583 | $444,500 | $132,500 | $312,000 |
| 2024 | $5,372 | $417,700 | $121,000 | $296,700 |
| 2023 | $5,176 | $396,600 | $115,200 | $281,400 |
| 2022 | $5,101 | $362,300 | $96,100 | $266,200 |
| 2021 | $4,937 | $342,600 | $96,100 | $246,500 |
| 2020 | $4,767 | $335,200 | $96,100 | $239,100 |
| 2019 | $4,669 | $328,600 | $96,100 | $232,500 |
| 2018 | $4,456 | $309,200 | $96,900 | $212,300 |
| 2017 | $4,048 | $282,300 | $96,900 | $185,400 |
| 2016 | $3,968 | $277,700 | $100,800 | $176,900 |
| 2015 | $3,805 | $267,000 | $96,900 | $170,100 |
| 2014 | $3,816 | $260,300 | $93,500 | $166,800 |
Seller's Agent in 2016
Michelle O'mara
MAssachusetts Real Estate Group
(508) 254-2819
5 in this area
21 Total Sales
Source: MLS Property Information Network (MLS PIN)
MLS Number: 71830328
APN: BELL-000078-000054
Disclaimer: Certain information contained herein is derived from information provided by parties other than Homes.com. All information provided is deemed reliable, but is not guaranteed to be accurate and should be independently verified.
![]() The property listing data and information, or the Images, set forth herein were provided to MLS Property Information Network, Inc. from third party sources, including sellers, lessors and public records, and were compiled by MLS Property Information Network, Inc. The property listing data and information, and the Images, are for the personal, non-commercial use of consumers having a good faith interest in purchasing or leasing listed properties of the type displayed to them and may not be used for any purpose other than to identify prospective properties which such consumers may have a good faith interest in purchasing or leasing. MLS Property Information Network, Inc. and its subscribers disclaim any and all representations and warranties as to the accuracy of the property listing data and information, or as to the accuracy of any of the Images, set forth herein.
The property listing data and information, or the Images, set forth herein were provided to MLS Property Information Network, Inc. from third party sources, including sellers, lessors and public records, and were compiled by MLS Property Information Network, Inc. The property listing data and information, and the Images, are for the personal, non-commercial use of consumers having a good faith interest in purchasing or leasing listed properties of the type displayed to them and may not be used for any purpose other than to identify prospective properties which such consumers may have a good faith interest in purchasing or leasing. MLS Property Information Network, Inc. and its subscribers disclaim any and all representations and warranties as to the accuracy of the property listing data and information, or as to the accuracy of any of the Images, set forth herein.