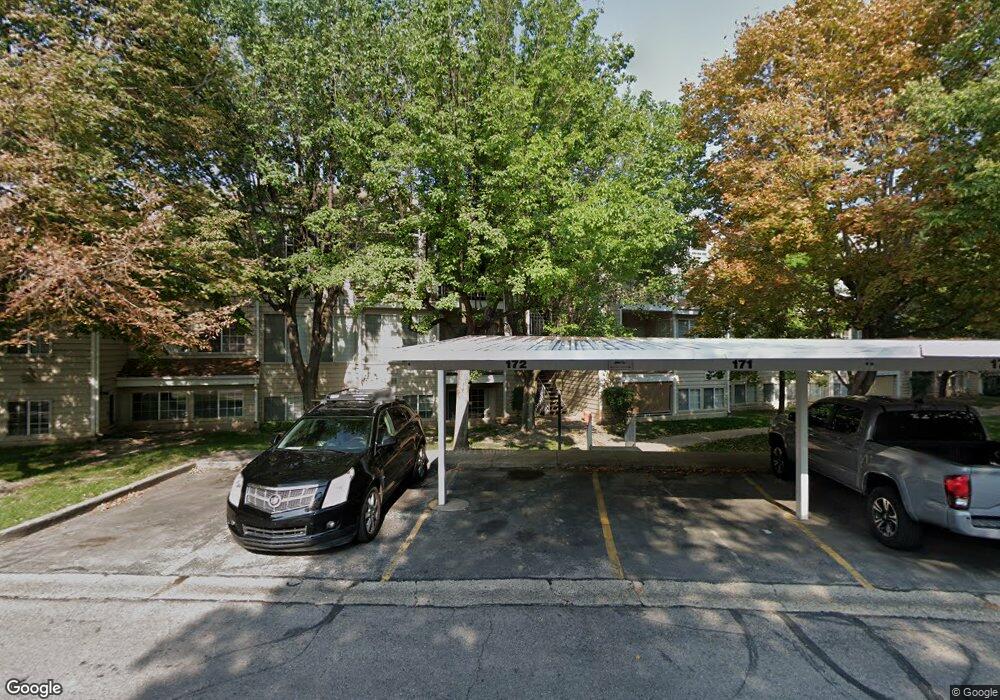
650 S Main St Unit 9106 Bountiful, UT 84010
Estimated Value: $285,000 - $298,000
2
Beds
2
Baths
1,011
Sq Ft
$289/Sq Ft
Est. Value
About This Home
This home is located at 650 S Main St Unit 9106, Bountiful, UT 84010 and is currently estimated at $292,463, approximately $289 per square foot. 650 S Main St Unit 9106 is a home located in Davis County with nearby schools including Bountiful Elementary School, Millcreek Junior High School, and Bountiful High School.
Ownership History
Date
Name
Owned For
Owner Type
Purchase Details
Closed on
Aug 23, 2021
Sold by
Mcgarrell Patricia J and Patricia J Mcgarrell Family Tr
Bought by
Kocherhans Sarah and Kocherhans Joshua
Current Estimated Value
Home Financials for this Owner
Home Financials are based on the most recent Mortgage that was taken out on this home.
Original Mortgage
$258,990
Outstanding Balance
$233,078
Interest Rate
2.8%
Mortgage Type
New Conventional
Estimated Equity
$59,385
Purchase Details
Closed on
Mar 28, 2013
Sold by
Mcgarrell Patricia J
Bought by
Mcgarrell Patricia J and The Patricia J Mcgarrell Family Trust
Purchase Details
Closed on
May 13, 2003
Sold by
Flake Ken M
Bought by
Mcgarrell Patricia J
Purchase Details
Closed on
Jan 6, 2003
Sold by
Tda Properties Llc
Bought by
Flake Kenneth M
Purchase Details
Closed on
Sep 10, 1996
Sold by
Flake Kenneth M
Bought by
Tda Properties Llc
Create a Home Valuation Report for This Property
The Home Valuation Report is an in-depth analysis detailing your home's value as well as a comparison with similar homes in the area
Purchase History
We collect this data history from publicly available records. To have your information removed, we recommend requesting removal directly through your county’s website.
| Date | Buyer | Sale Price | Title Company |
|---|---|---|---|
| Kocherhans Sarah | -- | Mountain View Titl | |
| Mcgarrell Patricia J | -- | None Available | |
| Mcgarrell Patricia J | -- | First American Title Co | |
| Flake Kenneth M | -- | First American Title Co | |
| Tda Properties Llc | -- | -- |
Source: Public Records
Mortgage History
We collect this data history from publicly available records. To have your information removed, we recommend requesting removal directly through your county’s website.
| Date | Status | Borrower | Loan Amount |
|---|---|---|---|
| Open | Kocherhans Sarah | $258,990 |
Source: Public Records
Tax History
| Year | Tax Paid | Tax Assessment Tax Assessment Total Assessment is a certain percentage of the fair market value that is determined by local assessors to be the total taxable value of land and additions on the property. | Land | Improvement |
|---|---|---|---|---|
| 2025 | $1,560 | $145,200 | $48,950 | $96,250 |
| 2024 | $1,556 | $147,950 | $54,450 | $93,500 |
| 2023 | $1,539 | $266,000 | $93,000 | $173,000 |
| 2022 | $1,550 | $146,850 | $32,450 | $114,400 |
| 2021 | $1,385 | $200,000 | $46,000 | $154,000 |
| 2020 | $1,215 | $176,000 | $42,600 | $133,400 |
| 2019 | $1,189 | $168,000 | $39,000 | $129,000 |
| 2018 | $1,088 | $151,000 | $36,000 | $115,000 |
| 2016 | $944 | $70,950 | $13,750 | $57,200 |
| 2015 | $929 | $65,945 | $13,750 | $52,195 |
| 2014 | $832 | $60,332 | $18,333 | $41,999 |
| 2013 | -- | $70,375 | $13,475 | $56,900 |
Source: Public Records
Map
Nearby Homes
- 650 S Main St Unit 7107
- 650 S Main St Unit 4104
- 650 S Main St Unit 3304
- 650 S Main St Unit 6206
- 650 S Main St Unit 6103
- 32 W 400 S
- 545 S 100 E
- 185 W 850 S
- 281 W 650 S
- 797 S 350 W
- 146 E 100 S Unit 4
- 185 E 1100 S
- 375 W 740 S
- 337 Peach Ln
- 323 Peach Ln
- 378 W 200 S
- 447 E 550 S
- 1350 S 200 W
- 456 E 500 S
- 147 W 25 N Unit 5
- 650 S Main St Unit 5204
- 650 S Main St Unit 5203
- 650 S Main St Unit 5202
- 650 S Main St Unit 5201
- 650 S Main St Unit 5104
- 650 S Main St Unit 5103
- 650 S Main St Unit 5102
- 650 S Main St Unit 5101
- 650 S Main St Unit 9304
- 650 S Main St Unit 9303
- 650 S Main St Unit 9302
- 650 S Main St Unit 9301
- 650 S Main St Unit 9206
- 650 S Main St Unit 9205
- 650 S Main St Unit 9204
- 650 S Main St Unit 9203
- 650 S Main St Unit 9202
- 650 S Main St Unit 9201
- 650 S Main St Unit 9105
- 650 S Main St Unit 9104
Your Personal Tour Guide
Ask me questions while you tour the home.