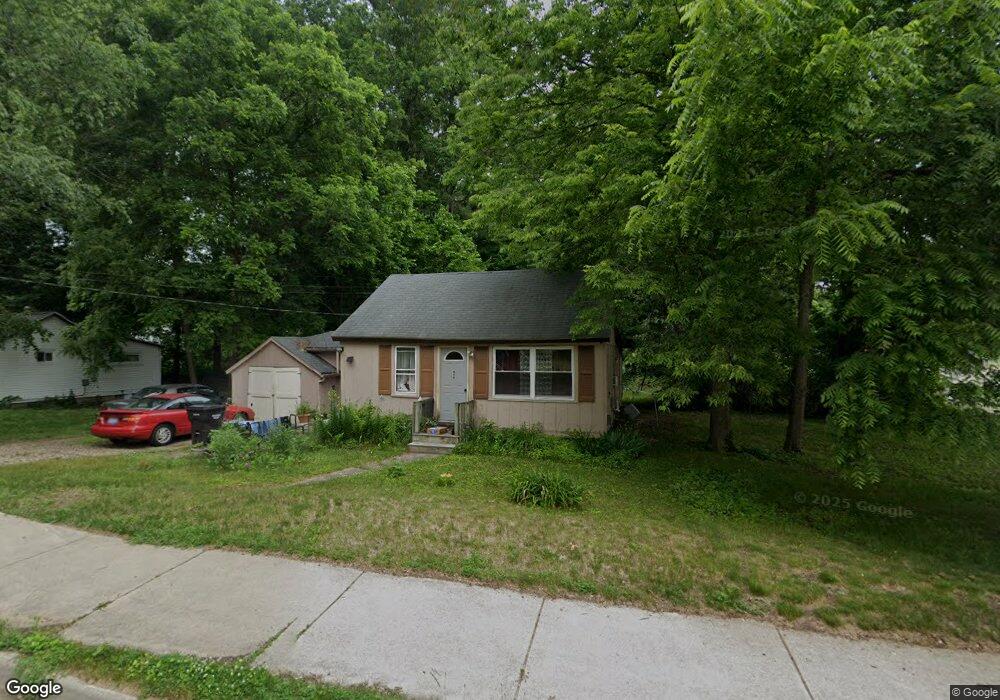
650 Vernon St Allegan, MI 49010
Estimated Value: $145,000 - $177,000
--
Bed
1
Bath
1,008
Sq Ft
$160/Sq Ft
Est. Value
About This Home
This home is located at 650 Vernon St, Allegan, MI 49010 and is currently estimated at $161,213, approximately $159 per square foot. 650 Vernon St is a home located in Allegan County with nearby schools including West Ward Elementary School, L.E. White Middle School, and Allegan High School.
Ownership History
Date
Name
Owned For
Owner Type
Purchase Details
Closed on
Mar 24, 2015
Sold by
New Day Homes Llc
Bought by
Lane Glendene
Current Estimated Value
Purchase Details
Closed on
Nov 25, 2014
Sold by
New Day Homes Llc
Bought by
Lane Glendene
Purchase Details
Closed on
Aug 28, 2014
Sold by
Allegan County Treasurer
Bought by
Lannin Charlie Lewis and Lannin Stacy Meredith
Purchase Details
Closed on
Apr 21, 1997
Sold by
Portrum William and Portrum Wf
Bought by
Williams Camille and Williams Portrum W
Create a Home Valuation Report for This Property
The Home Valuation Report is an in-depth analysis detailing your home's value as well as a comparison with similar homes in the area
Home Values in the Area
Average Home Value in this Area
Purchase History
| Date | Buyer | Sale Price | Title Company |
|---|---|---|---|
| Lane Glendene | $34,000 | None Available | |
| Lane Glendene | -- | None Available | |
| New Day Homes Llc | -- | None Available | |
| Lannin Charlie Lewis | $15,250 | None Available | |
| Williams Camille | -- | -- |
Source: Public Records
Tax History Compared to Growth
Tax History
| Year | Tax Paid | Tax Assessment Tax Assessment Total Assessment is a certain percentage of the fair market value that is determined by local assessors to be the total taxable value of land and additions on the property. | Land | Improvement |
|---|---|---|---|---|
| 2025 | $1,212 | $60,600 | $21,100 | $39,500 |
| 2024 | $1,103 | $58,700 | $20,300 | $38,400 |
| 2023 | $1,143 | $51,200 | $19,000 | $32,200 |
| 2022 | $1,103 | $43,300 | $16,000 | $27,300 |
| 2021 | $1,055 | $39,000 | $12,700 | $26,300 |
| 2020 | $1,040 | $37,300 | $10,600 | $26,700 |
| 2019 | $1,014 | $33,100 | $9,500 | $23,600 |
| 2018 | $974 | $28,600 | $9,300 | $19,300 |
| 2017 | $0 | $26,100 | $7,700 | $18,400 |
| 2016 | $0 | $21,700 | $6,500 | $15,200 |
| 2015 | -- | $21,700 | $6,500 | $15,200 |
| 2014 | -- | $16,700 | $6,500 | $10,200 |
| 2013 | -- | $17,200 | $6,500 | $10,700 |
Source: Public Records
Map
Nearby Homes