650 W 60 N Parowan, UT 84761
Estimated Value: $308,000 - $354,000
3
Beds
2
Baths
1,402
Sq Ft
$236/Sq Ft
Est. Value
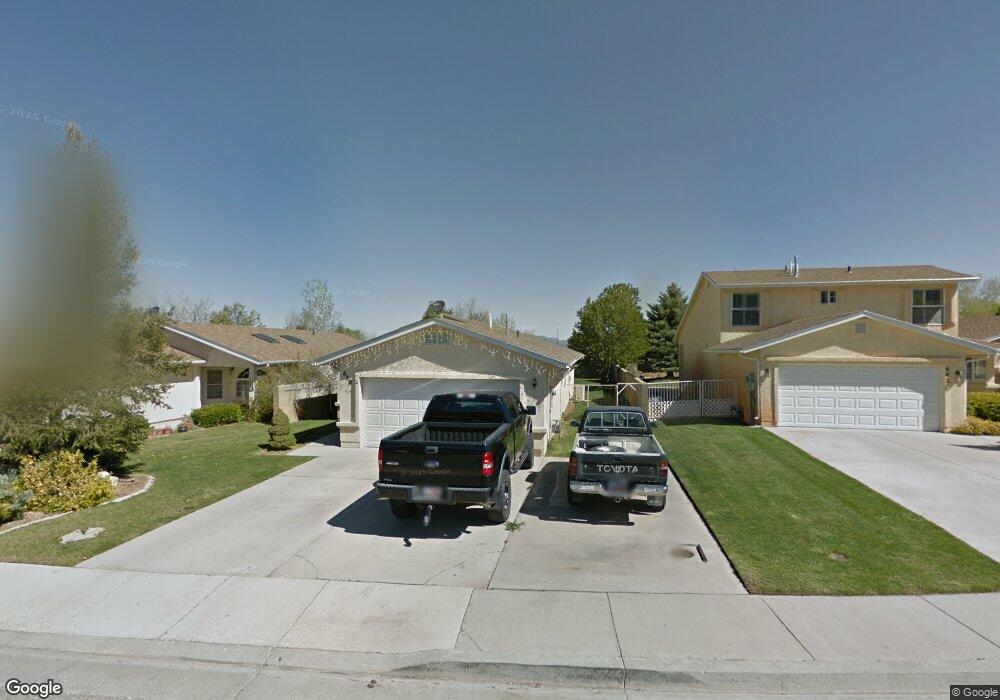
About This Home
This home is located at 650 W 60 N, Parowan, UT 84761 and is currently estimated at $330,964, approximately $236 per square foot. 650 W 60 N is a home located in Iron County with nearby schools including Parowan School, Parowan High School, and Cedar City High School.
Ownership History
Date
Name
Owned For
Owner Type
Purchase Details
Closed on
Jun 14, 2018
Sold by
Rose Evan and Rose Cindy
Bought by
Walker Trevor Kyle and Walker Cassandra Hill
Current Estimated Value
Home Financials for this Owner
Home Financials are based on the most recent Mortgage that was taken out on this home.
Original Mortgage
$165,938
Outstanding Balance
$145,052
Interest Rate
4.99%
Mortgage Type
FHA
Estimated Equity
$185,912
Purchase Details
Closed on
Mar 5, 2009
Sold by
Weyandt Cody
Bought by
Rose Evan Cindy
Purchase Details
Closed on
Apr 13, 2007
Sold by
Rose Evan and Rose Cindy
Bought by
Rose Evan and Rose Cindy
Create a Home Valuation Report for This Property
The Home Valuation Report is an in-depth analysis detailing your home's value as well as a comparison with similar homes in the area
Home Values in the Area
Average Home Value in this Area
Purchase History
| Date | Buyer | Sale Price | Title Company |
|---|---|---|---|
| Walker Trevor Kyle | -- | Inwest Title Services St | |
| Rose Evan Cindy | -- | -- | |
| Rose Evan | -- | -- |
Source: Public Records
Mortgage History
| Date | Status | Borrower | Loan Amount |
|---|---|---|---|
| Open | Walker Trevor Kyle | $165,938 |
Source: Public Records
Tax History Compared to Growth
Tax History
| Year | Tax Paid | Tax Assessment Tax Assessment Total Assessment is a certain percentage of the fair market value that is determined by local assessors to be the total taxable value of land and additions on the property. | Land | Improvement |
|---|---|---|---|---|
| 2025 | $1,247 | $154,726 | $26,091 | $128,635 |
| 2023 | $1,207 | $153,110 | $26,090 | $127,020 |
| 2022 | $1,241 | $129,570 | $23,720 | $105,850 |
| 2021 | $842 | $87,930 | $9,490 | $78,440 |
| 2020 | $945 | $87,225 | $9,490 | $77,735 |
| 2019 | $883 | $77,740 | $9,490 | $68,250 |
| 2018 | $888 | $76,500 | $8,250 | $68,250 |
| 2017 | $805 | $67,680 | $8,250 | $59,430 |
| 2016 | $783 | $62,350 | $8,250 | $54,100 |
| 2015 | $839 | $63,070 | $0 | $0 |
| 2014 | $879 | $63,070 | $0 | $0 |
Source: Public Records
Map
Nearby Homes