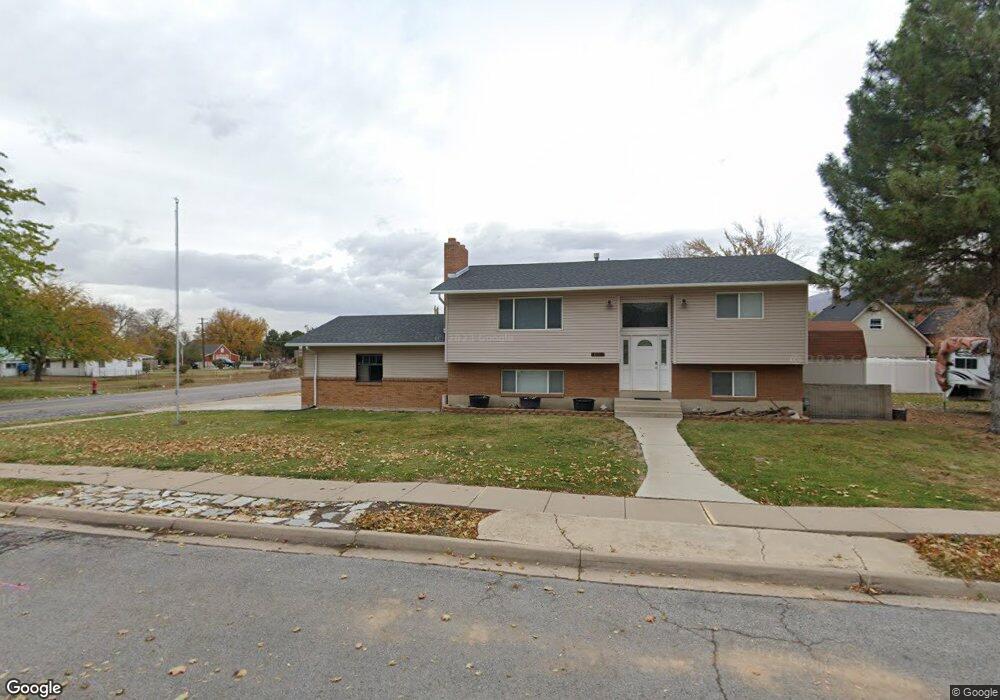
650 W 900 N West Bountiful, UT 84087
Estimated Value: $511,000 - $547,000
3
Beds
2
Baths
2,300
Sq Ft
$230/Sq Ft
Est. Value
About This Home
This home is located at 650 W 900 N, West Bountiful, UT 84087 and is currently estimated at $529,079, approximately $230 per square foot. 650 W 900 N is a home located in Davis County with nearby schools including West Bountiful Elementary School, Bountiful Junior High School, and Viewmont High School.
Ownership History
Date
Name
Owned For
Owner Type
Purchase Details
Closed on
Apr 2, 2013
Sold by
Hill Jerry A
Bought by
Hill Jerry Allen
Current Estimated Value
Purchase Details
Closed on
Jun 25, 2004
Sold by
Tenney Robyn M
Bought by
Hill Jerry A
Home Financials for this Owner
Home Financials are based on the most recent Mortgage that was taken out on this home.
Original Mortgage
$145,000
Outstanding Balance
$72,256
Interest Rate
6.29%
Mortgage Type
Purchase Money Mortgage
Estimated Equity
$456,823
Purchase Details
Closed on
Jan 10, 2002
Sold by
Sellers Terry B
Bought by
Sellers Terry B and Tenney Robyn M
Purchase Details
Closed on
Mar 29, 1996
Sold by
Sellers Linda T
Bought by
Sellers Terry B
Home Financials for this Owner
Home Financials are based on the most recent Mortgage that was taken out on this home.
Original Mortgage
$76,000
Interest Rate
6.79%
Mortgage Type
Balloon
Create a Home Valuation Report for This Property
The Home Valuation Report is an in-depth analysis detailing your home's value as well as a comparison with similar homes in the area
Home Values in the Area
Average Home Value in this Area
Purchase History
| Date | Buyer | Sale Price | Title Company |
|---|---|---|---|
| Hill Jerry Allen | -- | None Available | |
| Hill Jerry A | -- | Heritage West Title Ins | |
| Hill Jerry | -- | Heritage West Title Ins | |
| Sellers Terry B | -- | -- | |
| Sellers Terry B | -- | Associated Title Company |
Source: Public Records
Mortgage History
| Date | Status | Borrower | Loan Amount |
|---|---|---|---|
| Open | Hill Jerry A | $145,000 | |
| Previous Owner | Sellers Terry B | $76,000 |
Source: Public Records
Tax History Compared to Growth
Tax History
| Year | Tax Paid | Tax Assessment Tax Assessment Total Assessment is a certain percentage of the fair market value that is determined by local assessors to be the total taxable value of land and additions on the property. | Land | Improvement |
|---|---|---|---|---|
| 2025 | $2,956 | $256,300 | $134,662 | $121,638 |
| 2024 | $2,871 | $255,750 | $110,783 | $144,967 |
| 2023 | $2,747 | $449,000 | $209,237 | $239,763 |
| 2022 | $2,743 | $250,800 | $100,629 | $150,171 |
| 2021 | $2,543 | $357,000 | $136,247 | $220,753 |
| 2020 | $2,324 | $323,000 | $126,027 | $196,973 |
| 2019 | $2,227 | $306,000 | $126,850 | $179,150 |
| 2018 | $2,048 | $277,000 | $126,555 | $150,445 |
| 2016 | $1,714 | $125,675 | $33,620 | $92,055 |
| 2015 | $1,643 | $114,565 | $33,620 | $80,945 |
| 2014 | $1,564 | $112,091 | $33,620 | $78,471 |
| 2013 | -- | $103,523 | $29,974 | $73,549 |
Source: Public Records
Map
Nearby Homes
- 790 N 500 W
- 366 W 1000 N
- 825 W 1320 N
- 340 N 500 W Unit 204
- 399 W 400 N Unit 47
- Lincoln Farmhouse Plan at Belmont Farms
- Belmont Traditional Plan at Belmont Farms
- Hampton Traditional Plan at Belmont Farms
- 767 W 220 N
- 637 W 1600 N
- 553 N 200 W
- 499 N 200 W Unit 30
- 499 N 200 W Unit 19
- 184 Park Shadows Cir
- 1194 N 200 W
- 235 W 1400 N
- 1503 N 300 W
- 810 Park Shadows Cir
- 1260 N 200 W
- 106 W 700 N