NOT LISTED FOR SALE

Estimated Value: $140,150 - $153,000

3 Beds
2 Baths
1,770 Sq Ft
$83/Sq Ft Est. Value

Last Sold March 25, 2021

Last sale price $100,000 $56 Per Sq Ft

Est. 46% increase in value since last sale

Current estimated payment $1,076/month

About This Home

As of March 2021

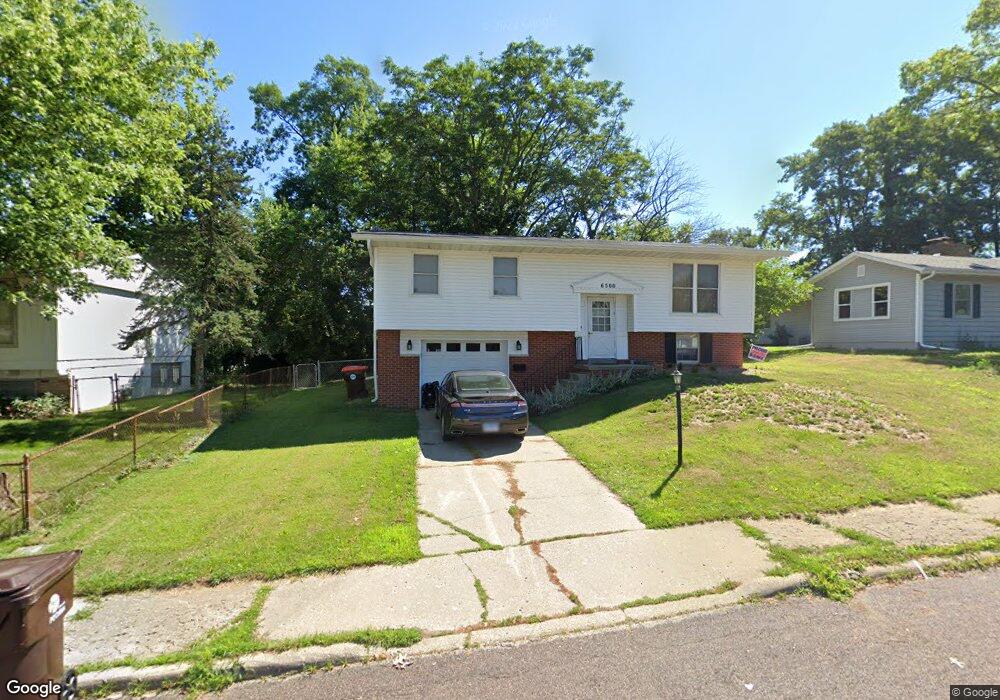
This home is located at 6500 N Randwick Rd, Peoria, IL 61615 and is currently estimated at $146,288, approximately $82 per square foot. 6500 N Randwick Rd is a home located in Peoria County with nearby schools including Charter Oak Primary School, Mark W. Bills Middle School, and Richwoods High School.

Ownership History

Date Name Owned For Owner Type

Purchase Details

Listed on
Feb 19, 2021
Closed on
Mar 24, 2021
Sold by
Borsch Christopher D
Bought by
Amb07 Properties Llc
Seller's Agent
Sandi Beck
RE/MAX Traders Unlimited
Buyer's Agent
Rhonda Milburn
Keller Williams Premier Realty
List Price
$105,000
Sold Price
$100,000
Premium/Discount to List
-$5,000
-4.76%
Current Estimated Value
$146,288

Home Financials for this Owner

Home Financials are based on the most recent Mortgage that was taken out on this home.
Estimated Appreciation
$46,288
Avg. Annual Appreciation
8.72%
Original Mortgage
$100,000
Interest Rate
3.75%
Mortgage Type
New Conventional

Purchase Details

Closed on
Jun 26, 2008
Bought by
Borsch Christopher D
Source: Public Records

Range of Values:

Collateral Analytics

Collateral Analytics Collateral Analytics AVMs (Automated Valuation Model) employ a number of statistical approaches combined with neighborhood-specific comparable selection guarantees the most up-to-date and precise valuations.

Not Available

Collateral Analytics does not have data for the current month. Please view the chart for historical values.

ICE

ICE Mortgage Technology ICE Mortgage Technology’s AVM (Automated Valuation Model) is a state-of-the-art online residential property valuation tool that provides a quick and accurate estimate of the value of almost any home in the U.S.

Not Available

ICE Mortgage Technology does not have data for the current month. Please view the chart for historical values.

First American

First American First American Data & Analytics’ next-generation AVM combines unrivaled data assets with a blended ensemble of valuation models to produce highly accurate, reliable valuations you can trust.

Not Available

First American does not have data for the current month. Please view the chart for historical values.

Quantarium

Quantarium Quantarium’s valuation service, repeatedly proven the industry’s most accurate and comprehensive, is supercharged with a self-learning and auto-tuning AI engine that continually becomes smarter and more accurate as it processes daily inputs from the industry’s leading RE data lake.

Not Available

Quantarium does not have data for the current month. Please view the chart for historical values.

Average Value
Not Available
List Price
Sold Price
Create a Home Valuation Report for This Property
The Home Valuation Report is an in-depth analysis detailing your home's value as well as a comparison with similar homes in the area

Home Values in the Area

Source: Public Records

Average Home Value in this Area


Source: Public Records

Purchase History

Date Buyer Sale Price Title Company
Amb07 Properties Llc $100,000 Cusack Gilfillan Oday Llc
Borsch Christopher D $93,000 --
Source: Public Records

Mortgage History

Date Status Borrower Loan Amount
Closed Amb07 Properties Llc $100,000
Source: Public Records

Property History

Date Event Price List to Sale Price per Sq Ft Prior Sale
03/25/2021 03/25/21 Sold $100,000 -4.8% $56 / Sq Ft View Prior Sale
02/25/2021 02/25/21 Pending -- -- --
02/23/2021 02/23/21 For Sale $105,000 -- $59 / Sq Ft

Tax History Compared to Growth

Source: Public Records

Tax History

Year Tax Paid Tax Assessment Tax Assessment Total Assessment is a certain percentage of the fair market value that is determined by local assessors to be the total taxable value of land and additions on the property. Land Improvement
2024 $3,614 $39,960 $4,840 $35,120
2023 $3,449 $36,660 $4,440 $32,220
2022 $3,213 $33,310 $4,050 $29,260
2021 $2,558 $31,730 $3,860 $27,870
2020 $2,546 $31,410 $3,820 $27,590
2019 $2,595 $32,050 $3,900 $28,150
2018 $2,475 $31,410 $3,940 $27,470
2017 $2,462 $31,730 $3,980 $27,750
2016 $2,400 $31,730 $3,980 $27,750
2015 $2,251 $31,110 $3,900 $27,210
2014 $2,257 $30,450 $3,710 $26,740
2013 -- $30,810 $3,750 $27,060
Source: Public Records

Agents Affiliated with this Home

  • Section Image
  • Section Image
See All Agents

Map