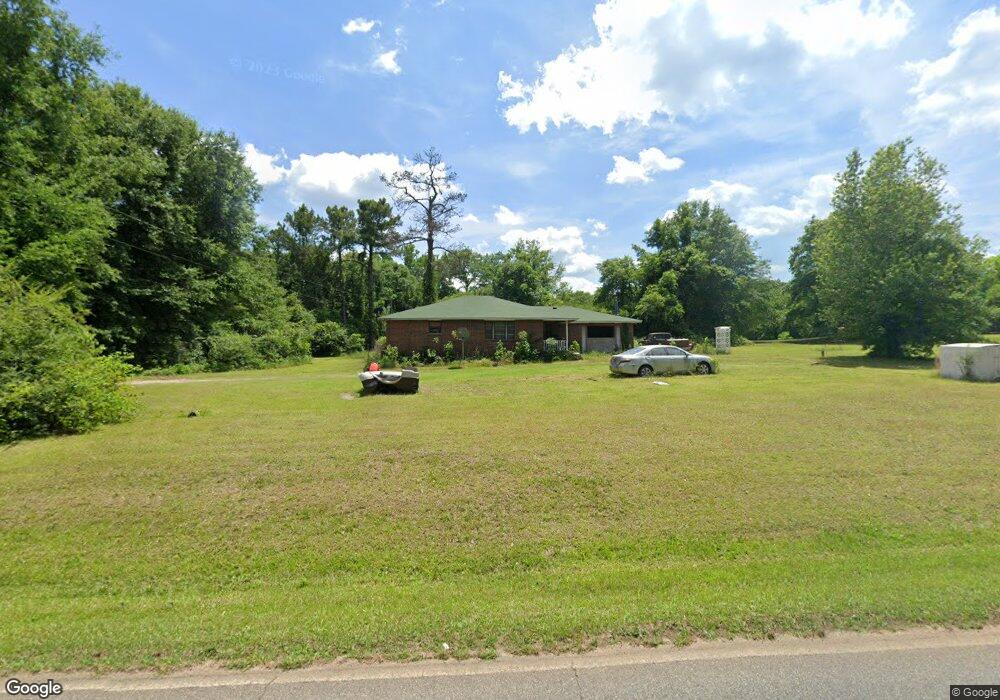
6500 Old Gordon Rd Dry Branch, GA 31020
Estimated Value: $106,685 - $176,000
--
Bed
2
Baths
1,696
Sq Ft
$90/Sq Ft
Est. Value
About This Home
This home is located at 6500 Old Gordon Rd, Dry Branch, GA 31020 and is currently estimated at $152,671, approximately $90 per square foot. 6500 Old Gordon Rd is a home located in Twiggs County with nearby schools including Jeffersonville Elementary School, Twiggs Middle School, and Twiggs County High School.
Ownership History
Date
Name
Owned For
Owner Type
Purchase Details
Closed on
Jun 12, 2023
Sold by
Sanders Angela K
Bought by
Sanders Bobby Lee
Current Estimated Value
Home Financials for this Owner
Home Financials are based on the most recent Mortgage that was taken out on this home.
Original Mortgage
$72,000
Interest Rate
6.12%
Mortgage Type
New Conventional
Purchase Details
Closed on
Jul 25, 2005
Sold by
Citifinancial Inc
Bought by
Sanders Angela K
Home Financials for this Owner
Home Financials are based on the most recent Mortgage that was taken out on this home.
Original Mortgage
$59,000
Interest Rate
8.5%
Mortgage Type
New Conventional
Purchase Details
Closed on
Jul 6, 2004
Sold by
Patterson Helen Fran
Bought by
Citifinancial Services Inc
Purchase Details
Closed on
Aug 5, 1987
Bought by
Patterson Helen Fran
Create a Home Valuation Report for This Property
The Home Valuation Report is an in-depth analysis detailing your home's value as well as a comparison with similar homes in the area
Home Values in the Area
Average Home Value in this Area
Purchase History
| Date | Buyer | Sale Price | Title Company |
|---|---|---|---|
| Sanders Bobby Lee | -- | -- | |
| Sanders Angela K | $59,000 | -- | |
| Citifinancial Services Inc | $73,000 | -- | |
| Patterson Helen Fran | -- | -- |
Source: Public Records
Mortgage History
| Date | Status | Borrower | Loan Amount |
|---|---|---|---|
| Previous Owner | Sanders Bobby Lee | $72,000 | |
| Previous Owner | Sanders Angela K | $59,000 |
Source: Public Records
Tax History Compared to Growth
Tax History
| Year | Tax Paid | Tax Assessment Tax Assessment Total Assessment is a certain percentage of the fair market value that is determined by local assessors to be the total taxable value of land and additions on the property. | Land | Improvement |
|---|---|---|---|---|
| 2024 | $918 | $31,644 | $3,015 | $28,629 |
| 2023 | $920 | $31,644 | $3,015 | $28,629 |
| 2022 | $1,145 | $31,644 | $3,015 | $28,629 |
| 2021 | $1,146 | $31,644 | $3,015 | $28,629 |
| 2020 | $1,146 | $31,644 | $3,015 | $28,629 |
| 2019 | $1,211 | $33,442 | $3,015 | $30,427 |
| 2018 | $1,110 | $33,442 | $3,015 | $30,427 |
| 2017 | $1,110 | $33,442 | $3,015 | $30,427 |
| 2016 | $0 | $30,427 | $0 | $30,427 |
| 2015 | -- | $33,442 | $3,015 | $30,427 |
| 2014 | -- | $33,442 | $3,015 | $30,427 |
| 2013 | -- | $36,974 | $3,014 | $33,960 |
Source: Public Records
Map
Nearby Homes
- 0 Old Gordon Rd
- 451 Possum Hollow Rd
- 0 Old Gordon Rd Unit 179400
- 0 Old Gordon Rd Unit 252673
- 290 Forestwood Dr
- 4912 Old Gordon Rd
- 190 Bond Ct
- 1659 Henderson Rd
- 6678 Davis Rd
- 947 Bellhouse Rd
- Hwy 129
- 9532 Old Gordon Rd
- 0 Us Highway 80 Unit LOT 1 10495040
- 0 Us Highway 80 Unit 23234269
- 0 Knollwood Rd Unit LotWP004
- 0 Knollwood Rd Unit 10495049
- 5757 Jeffersonville Rd
- 32 Knollwood Rd
- 6396 Old Gordon Rd
- 6398 Old Gordon Rd
- 6584 Old Gordon Rd
- 6374 Old Gordon Rd
- 6720 Old Gordon Rd
- 6616 Old Gordon Rd
- 6310 Old Gordon Rd
- 6557 Old Gordon Rd
- 6619 Old Gordon Rd
- 6725 Old Gordon Rd
- 6254 Old Gordon Rd
- 6743 Old Gordon Rd
- 6771 Old Gordon Rd
- 6204 Old Gordon Rd
- 6795 Old Gordon Rd
- 6797 Old Gordon Rd
- 6032 Old Gordon Rd
- 140 Hickory Dr
- 136 Hickory Dr
- 6009 Old Gordon Rd