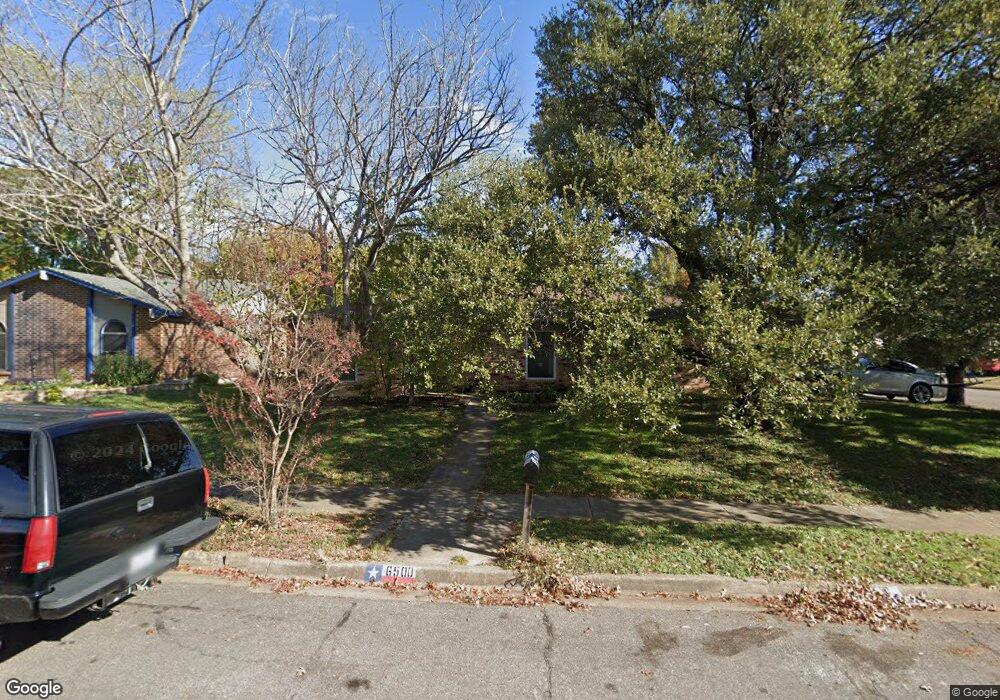
6500 Paula Ct North Richland Hills, TX 76182
Estimated Value: $342,000 - $362,105
3
Beds
2
Baths
1,534
Sq Ft
$232/Sq Ft
Est. Value
About This Home
This home is located at 6500 Paula Ct, North Richland Hills, TX 76182 and is currently estimated at $355,526, approximately $231 per square foot. 6500 Paula Ct is a home located in Tarrant County with nearby schools including Walker Creek Elementary School, Smithfield Middle School, and Birdville High School.
Ownership History
Date
Name
Owned For
Owner Type
Purchase Details
Closed on
Mar 16, 2022
Sold by
Ladet Bracequivel Kenny and Ladet Tedley
Bought by
Garza Cristy and Chavez Cristian
Current Estimated Value
Home Financials for this Owner
Home Financials are based on the most recent Mortgage that was taken out on this home.
Original Mortgage
$195,000
Outstanding Balance
$182,049
Interest Rate
3.85%
Mortgage Type
Balloon
Estimated Equity
$173,477
Purchase Details
Closed on
Oct 26, 2021
Sold by
Bracey Kenny Ladet and Esquivel Teodoro
Bought by
Bracequivel Kenny Ladet and Bracequivel Tedley
Purchase Details
Closed on
Jun 11, 2018
Sold by
Bracey Ken Ladet
Bought by
Bracey Ken Ladet and Esquivel Teodore
Purchase Details
Closed on
May 14, 2002
Sold by
Morey Jerry W and Morey Holly J
Bought by
Bracey Ken L and Esquivel Teodoro
Home Financials for this Owner
Home Financials are based on the most recent Mortgage that was taken out on this home.
Original Mortgage
$95,000
Interest Rate
7.1%
Create a Home Valuation Report for This Property
The Home Valuation Report is an in-depth analysis detailing your home's value as well as a comparison with similar homes in the area
Home Values in the Area
Average Home Value in this Area
Purchase History
| Date | Buyer | Sale Price | Title Company |
|---|---|---|---|
| Garza Cristy | -- | None Listed On Document | |
| Bracequivel Kenny Ladet | -- | None Available | |
| Bracey Ken Ladet | -- | None Available | |
| Bracey Ken L | -- | American Title Co |
Source: Public Records
Mortgage History
| Date | Status | Borrower | Loan Amount |
|---|---|---|---|
| Open | Garza Cristy | $195,000 | |
| Previous Owner | Bracey Ken L | $95,000 |
Source: Public Records
Tax History Compared to Growth
Tax History
| Year | Tax Paid | Tax Assessment Tax Assessment Total Assessment is a certain percentage of the fair market value that is determined by local assessors to be the total taxable value of land and additions on the property. | Land | Improvement |
|---|---|---|---|---|
| 2025 | $7,110 | $327,660 | $101,405 | $226,255 |
| 2024 | $7,110 | $327,660 | $101,405 | $226,255 |
| 2023 | $7,145 | $325,727 | $101,405 | $224,322 |
| 2022 | $6,162 | $256,061 | $40,000 | $216,061 |
| 2021 | $6,203 | $243,789 | $40,000 | $203,789 |
| 2020 | $4,725 | $211,995 | $40,000 | $171,995 |
| 2019 | $4,445 | $213,337 | $40,000 | $173,337 |
| 2018 | $3,543 | $153,464 | $40,000 | $113,464 |
| 2017 | $3,754 | $167,368 | $35,000 | $132,368 |
| 2016 | $3,412 | $148,474 | $17,000 | $131,474 |
| 2015 | $2,777 | $115,300 | $17,000 | $98,300 |
| 2014 | $2,777 | $115,300 | $17,000 | $98,300 |
Source: Public Records
Map
Nearby Homes
- 6509 Paula Ct
- 6625 Crane Rd
- 6505 Parkway Ave
- 6432 Brynwyck Ln
- 8920 Martin Dr
- 6521 Rock Springs Dr
- 8436 Town Walk Dr
- 8420 Town Walk Dr
- 8421 Randy Dr
- 6704 Nob Hill Ct
- 8412 Glenann Dr
- 6708 Nob Hill Ct
- 8409 Glenann Dr
- 8409 Main St
- 6801 Woodland Hills Dr
- 736 Springhill Dr
- 6921 Westover Way
- 8440 Stephanie Dr
- 8886 Ice House Dr
- 8740 Ice House Dr