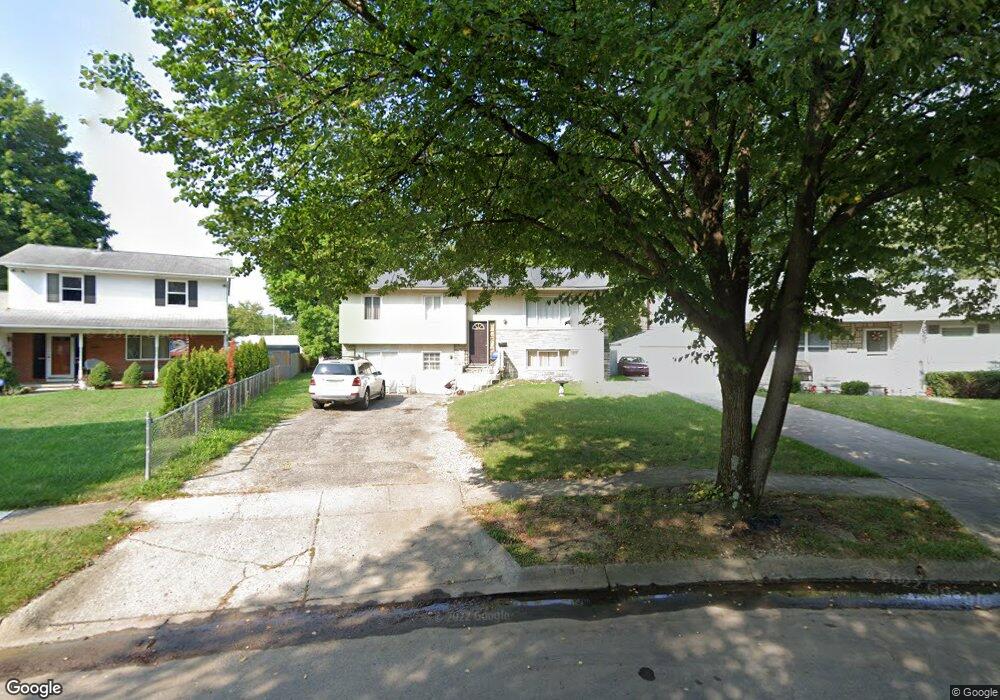
6501 Cranwood Square W Columbus, OH 43229
Devonshire NeighborhoodEstimated Value: $271,000 - $294,096
4
Beds
2
Baths
1,820
Sq Ft
$155/Sq Ft
Est. Value
About This Home
This home is located at 6501 Cranwood Square W, Columbus, OH 43229 and is currently estimated at $282,524, approximately $155 per square foot. 6501 Cranwood Square W is a home located in Franklin County with nearby schools including Devonshire Alternative Elementary School, Woodward Park Middle School, and Beechcroft High School.
Ownership History
Date
Name
Owned For
Owner Type
Purchase Details
Closed on
Nov 10, 2009
Sold by
Hsbc Bank Usa National Association
Bought by
Bassey Anna
Current Estimated Value
Home Financials for this Owner
Home Financials are based on the most recent Mortgage that was taken out on this home.
Original Mortgage
$92,072
Outstanding Balance
$59,965
Interest Rate
4.95%
Mortgage Type
FHA
Estimated Equity
$222,559
Purchase Details
Closed on
Mar 25, 2009
Sold by
Cunningham Danielle and Fremont Investment & Loan
Bought by
Hsbc Bank Usa National Association
Purchase Details
Closed on
Oct 7, 2004
Sold by
Cunningham Paul J
Bought by
Cunningham Danielle
Purchase Details
Closed on
May 28, 1999
Sold by
Jackson Roy E and Jackson Judy L
Bought by
Cunningham Paul J and Cunningham Danielle
Purchase Details
Closed on
Oct 24, 1975
Bought by
Jackson Roy E
Create a Home Valuation Report for This Property
The Home Valuation Report is an in-depth analysis detailing your home's value as well as a comparison with similar homes in the area
Home Values in the Area
Average Home Value in this Area
Purchase History
| Date | Buyer | Sale Price | Title Company |
|---|---|---|---|
| Bassey Anna | $65,000 | None Available | |
| Hsbc Bank Usa National Association | $74,000 | None Available | |
| Cunningham Danielle | -- | -- | |
| Cunningham Paul J | $97,600 | Chicago Title West | |
| Jackson Roy E | -- | Chicago Title West | |
| Jackson Roy E | -- | -- |
Source: Public Records
Mortgage History
| Date | Status | Borrower | Loan Amount |
|---|---|---|---|
| Open | Bassey Anna | $92,072 |
Source: Public Records
Tax History Compared to Growth
Tax History
| Year | Tax Paid | Tax Assessment Tax Assessment Total Assessment is a certain percentage of the fair market value that is determined by local assessors to be the total taxable value of land and additions on the property. | Land | Improvement |
|---|---|---|---|---|
| 2024 | $3,869 | $86,210 | $20,130 | $66,080 |
| 2023 | $3,813 | $86,065 | $20,125 | $65,940 |
| 2022 | $2,658 | $51,240 | $12,040 | $39,200 |
| 2021 | $2,749 | $51,240 | $12,040 | $39,200 |
| 2020 | $2,666 | $51,240 | $12,040 | $39,200 |
| 2019 | $2,482 | $40,920 | $9,630 | $31,290 |
| 2018 | $2,372 | $40,920 | $9,630 | $31,290 |
| 2017 | $2,481 | $40,920 | $9,630 | $31,290 |
| 2016 | $2,497 | $37,700 | $8,820 | $28,880 |
| 2015 | $2,267 | $37,700 | $8,820 | $28,880 |
| 2014 | $2,273 | $37,700 | $8,820 | $28,880 |
| 2013 | $1,246 | $41,895 | $9,800 | $32,095 |
Source: Public Records
Map
Nearby Homes
- 1268 Kildale Ct
- 1294 Clydesdale Ct
- 1409 Bosworth Place
- 1322 Bolenhill Ct
- 1421 Bosworth Place
- 6407 Faircrest Rd
- 6211 Parkdale Dr
- 6189 Northgap Dr
- 1288 Oakfield Dr N
- 6458 Faircrest Rd
- 1171 Newbury Dr
- 1549 Alpine Dr
- 1635 Tendril Ct
- 6342 Bellmeadow Dr
- 5990 Ambleside Dr
- 6035 Karl Rd
- 6407 Skywae Dr
- 1755 Hillandale Ave
- 6355 Johnanne St
- 6245 Sharon Woods Blvd
- 6497 Cranwood Square W
- 6507 Cranwood Square W
- 6433 Cranwood Square W
- 6435 Cranwood Square W
- 6437 Cranwood Square W
- 6439 Cranwood Square W
- 6443 Cranwood Square W
- 6445 Cranwood Square W
- 6447 Cranwood Square W
- 6449 Cranwood Square W
- 6453 Cranwood Square W
- 6455 Cranwood Square W
- 6457 Cranwood Square W
- 1237 Cranwood Square S
- 6459 Cranwood Square W
- 6463 Cranwood Square W
- 6465 Cranwood Square W
- 6467 Cranwood Square W
- 6469 Cranwood Square W
- 6515 Cranwood Square W