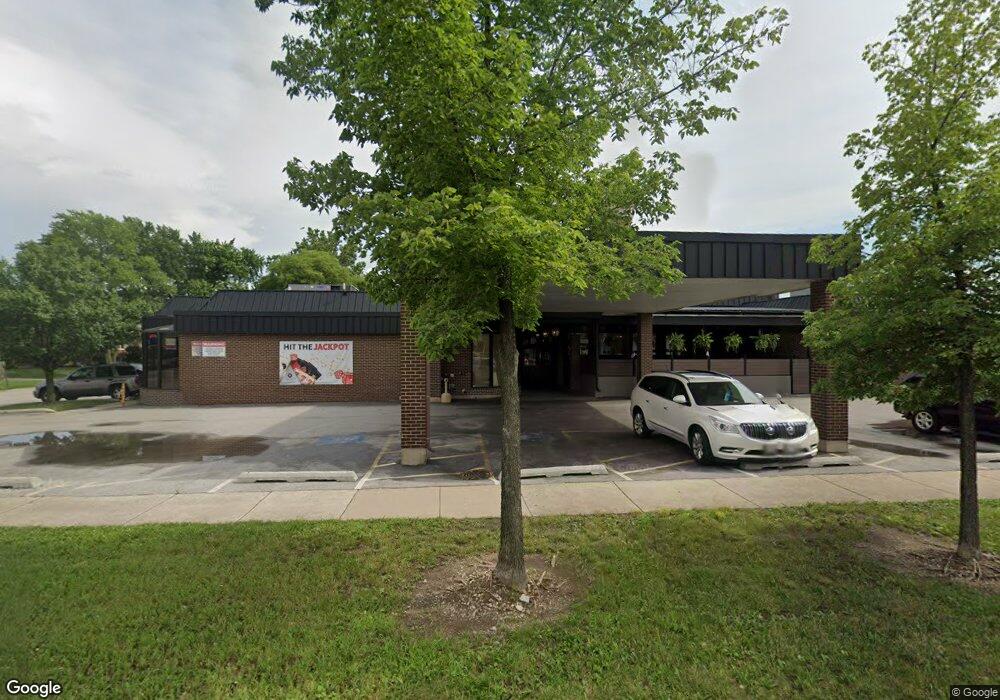
6501 W 79th St Burbank, IL 60459
--
Bed
--
Bath
11,000
Sq Ft
1.15
Acres
About This Home
This home is located at 6501 W 79th St, Burbank, IL 60459. 6501 W 79th St is a home located in Cook County with nearby schools including F B Mccord Elementary School, Reavis High School, and St Albert the Great Catholic School.
Ownership History
Date
Name
Owned For
Owner Type
Purchase Details
Closed on
Mar 30, 2009
Sold by
Citizens Community Bank Of Illinois
Bought by
Chucks Southern Comforts Llc
Home Financials for this Owner
Home Financials are based on the most recent Mortgage that was taken out on this home.
Original Mortgage
$1,023,229
Outstanding Balance
$652,727
Interest Rate
5.11%
Mortgage Type
Seller Take Back
Purchase Details
Closed on
Jul 8, 2008
Sold by
Seat Commercial Properties Inc
Bought by
Citizens Community Bank Of Illinois
Purchase Details
Closed on
Dec 28, 2004
Sold by
Suburban Bank & Trust Co
Bought by
Seat Commercial Properties Inc
Home Financials for this Owner
Home Financials are based on the most recent Mortgage that was taken out on this home.
Original Mortgage
$550,000
Interest Rate
5.83%
Mortgage Type
Purchase Money Mortgage
Create a Home Valuation Report for This Property
The Home Valuation Report is an in-depth analysis detailing your home's value as well as a comparison with similar homes in the area
Home Values in the Area
Average Home Value in this Area
Purchase History
| Date | Buyer | Sale Price | Title Company |
|---|---|---|---|
| Chucks Southern Comforts Llc | $1,300,000 | None Available | |
| Citizens Community Bank Of Illinois | -- | None Available | |
| Seat Commercial Properties Inc | $1,000,000 | Chicago Title Insurance Comp |
Source: Public Records
Mortgage History
| Date | Status | Borrower | Loan Amount |
|---|---|---|---|
| Open | Chucks Southern Comforts Llc | $1,023,229 | |
| Previous Owner | Seat Commercial Properties Inc | $550,000 | |
| Closed | Seat Commercial Properties Inc | $385,000 |
Source: Public Records
Tax History Compared to Growth
Tax History
| Year | Tax Paid | Tax Assessment Tax Assessment Total Assessment is a certain percentage of the fair market value that is determined by local assessors to be the total taxable value of land and additions on the property. | Land | Improvement |
|---|---|---|---|---|
| 2024 | $44,710 | $144,092 | $75,544 | $68,548 |
| 2023 | $70,462 | $144,092 | $75,544 | $68,548 |
| 2022 | $70,462 | $182,719 | $51,937 | $130,782 |
| 2021 | $67,422 | $182,716 | $51,936 | $130,780 |
| 2020 | $65,046 | $182,716 | $51,936 | $130,780 |
| 2019 | $80,908 | $225,819 | $42,493 | $183,326 |
| 2018 | $76,904 | $220,935 | $42,493 | $178,442 |
| 2017 | $74,358 | $220,935 | $42,493 | $178,442 |
| 2016 | $61,927 | $175,761 | $40,132 | $135,629 |
| 2015 | $59,622 | $175,761 | $40,132 | $135,629 |
| 2014 | $57,830 | $175,761 | $40,132 | $135,629 |
| 2013 | $47,078 | $156,611 | $40,132 | $116,479 |
Source: Public Records
Map
Nearby Homes
- 7900 Nagle Ave Unit 3S
- 7900 S Nagle Ave Unit 1S
- 8019 Natchez Ave
- 7943 Natoma Ave
- 7728 Natchez Ave
- 8646 S Nagle Ave
- 7712 Nagle Ave
- 7921 Mobile Ave
- 8001 Rutherford Ave
- 7721 Normandy Ave
- 7948 Merrimac Ave
- 6241 W 80th St
- 7858 Rutherford Ave Unit 3D
- 8138 Mulligan Ave
- 6437 W 82nd St
- 7707 Mobile Ave
- 7734 Melvina Ave
- 6127 W 79th Place
- 7912 New Castle Ave
- 8132 Oak Park Ave
- 6501 W 79th St
- 7914 Natchez Ave
- 7915 Neenah Ave
- 7917 Neenah Ave
- 7920 Natchez Ave
- 7921 Neenah Ave
- 6531 W 79th St
- 6510 W 79th St
- 6500 W 79th St
- 7926 Natchez Ave
- 7923 Neenah Ave
- 7923 Neenah Ave
- 7911 Natchez Ave
- 7910 Neenah Ave
- 6537 W 79th St Unit 2
- 6537 W 79th St Unit 2N
- 6537 W 79th St
- 6537 W 79th St Unit 3
- 6537 W 79th St Unit 1
- 6535 W 79th St