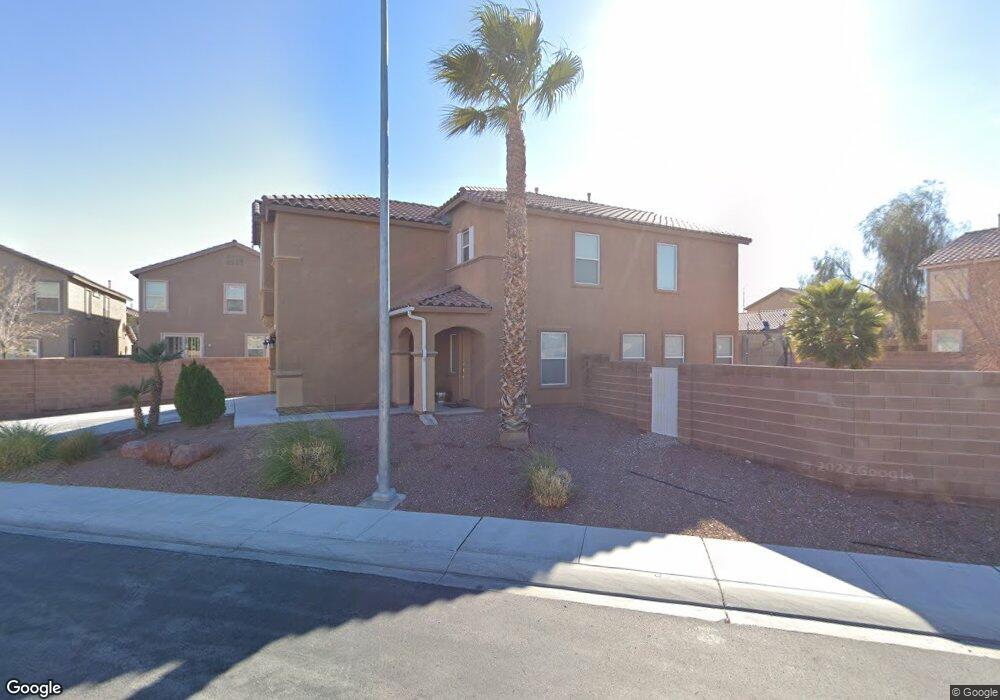
6503 Chebec St North Las Vegas, NV 89084
Aliante NeighborhoodEstimated Value: $458,000 - $464,587
3
Beds
3
Baths
2,205
Sq Ft
$209/Sq Ft
Est. Value
About This Home
This home is located at 6503 Chebec St, North Las Vegas, NV 89084 and is currently estimated at $460,397, approximately $208 per square foot. 6503 Chebec St is a home located in Clark County with nearby schools including Goynes Elementary School, Brian & Teri Cram Middle School, and Legacy High School.
Ownership History
Date
Name
Owned For
Owner Type
Purchase Details
Closed on
Nov 16, 2011
Sold by
Resources Group Llc
Bought by
Rodriguez Sanchez Carlos A
Current Estimated Value
Home Financials for this Owner
Home Financials are based on the most recent Mortgage that was taken out on this home.
Original Mortgage
$141,324
Outstanding Balance
$97,083
Interest Rate
4.25%
Mortgage Type
FHA
Estimated Equity
$363,314
Purchase Details
Closed on
May 12, 2011
Sold by
Miramontes Silvia
Bought by
Chebec St Trust
Purchase Details
Closed on
Jan 29, 2005
Sold by
Kb Home Nevada Inc
Bought by
Miramontes Sylvia
Home Financials for this Owner
Home Financials are based on the most recent Mortgage that was taken out on this home.
Original Mortgage
$322,900
Interest Rate
7%
Mortgage Type
Unknown
Purchase Details
Closed on
Jul 7, 2004
Sold by
North Valley Enterprises Llc
Bought by
Kb Home Nevada Inc
Create a Home Valuation Report for This Property
The Home Valuation Report is an in-depth analysis detailing your home's value as well as a comparison with similar homes in the area
Home Values in the Area
Average Home Value in this Area
Purchase History
| Date | Buyer | Sale Price | Title Company |
|---|---|---|---|
| Rodriguez Sanchez Carlos A | $150,000 | Fidelity National Title Las | |
| Chebec St Trust | $103,000 | None Available | |
| Miramontes Sylvia | $339,902 | First Amer Title Co Of Nv | |
| Kb Home Nevada Inc | -- | First American Title Company | |
| Kb Home Nevada Inc | $589,000 | First American Title Company |
Source: Public Records
Mortgage History
| Date | Status | Borrower | Loan Amount |
|---|---|---|---|
| Open | Rodriguez Sanchez Carlos A | $141,324 | |
| Previous Owner | Miramontes Sylvia | $322,900 |
Source: Public Records
Tax History Compared to Growth
Tax History
| Year | Tax Paid | Tax Assessment Tax Assessment Total Assessment is a certain percentage of the fair market value that is determined by local assessors to be the total taxable value of land and additions on the property. | Land | Improvement |
|---|---|---|---|---|
| 2025 | $1,874 | $119,800 | $35,280 | $84,520 |
| 2024 | $1,820 | $119,800 | $35,280 | $84,520 |
| 2023 | $1,332 | $115,023 | $35,280 | $79,743 |
| 2022 | $1,853 | $99,908 | $27,195 | $72,713 |
| 2021 | $1,716 | $95,372 | $26,460 | $68,912 |
| 2020 | $1,590 | $91,777 | $23,520 | $68,257 |
| 2019 | $1,490 | $90,200 | $23,100 | $67,100 |
| 2018 | $1,422 | $81,371 | $17,325 | $64,046 |
| 2017 | $2,558 | $76,263 | $17,325 | $58,938 |
| 2016 | $1,332 | $63,808 | $11,550 | $52,258 |
| 2015 | $1,329 | $46,854 | $8,750 | $38,104 |
| 2014 | $1,290 | $37,307 | $7,000 | $30,307 |
Source: Public Records
Map
Nearby Homes
- 6528 Chebec St
- 6527 Copper Smith Ct
- 2420 Mountain Rail Dr
- 2120 Marsh Tern Ct
- 2265 Stone Breeze Ave
- 2109 Silvereye Dr
- 6420 Indian Peak Ct
- 2305 Dalton Ridge Ct
- 6417 Giant Oak St
- 2312 Scissortail Ct
- 2265 Dixon Springs Ave
- 6424 Grayback Dr
- 6703 Tufted Duck Way
- 2208 Saddlebill Ct
- 6129 Bedrock Ct
- 1910 Night Shadow Ave
- 6130 Marvin St
- 6140 Passionate Ct
- 3221 Villa Pisani Ct
- 1821 Azure Oak Ave
- 2405 Crane Ct
- 2405 Crane Ct
- 2320 Cockatoo Dr
- 2312 Cockatoo Dr
- 2409 Crane Ct
- 2324 Cockatoo Dr
- 2324 Cockatoo Dr Unit n/a
- 6504 Chebec St
- 2308 Cockatoo Dr
- 6508 Chebec St
- 2404 Cockatoo Dr
- 2413 Crane Ct
- 6512 Chebec St
- 2408 Cockatoo Dr
- 6516 Chebec St
- 2417 Crane Ct
- 2412 Crane Ct
- 6468 Chebec St
- 6520 Chebec St
- 2412 Cockatoo Dr