
Landlord's Agent in 2024
Morgan Knull
RE/MAX Gateway, LLC
(202) 431-9867
4 in this area
171 Total Sales
Estimated Value: $248,000 - $292,000
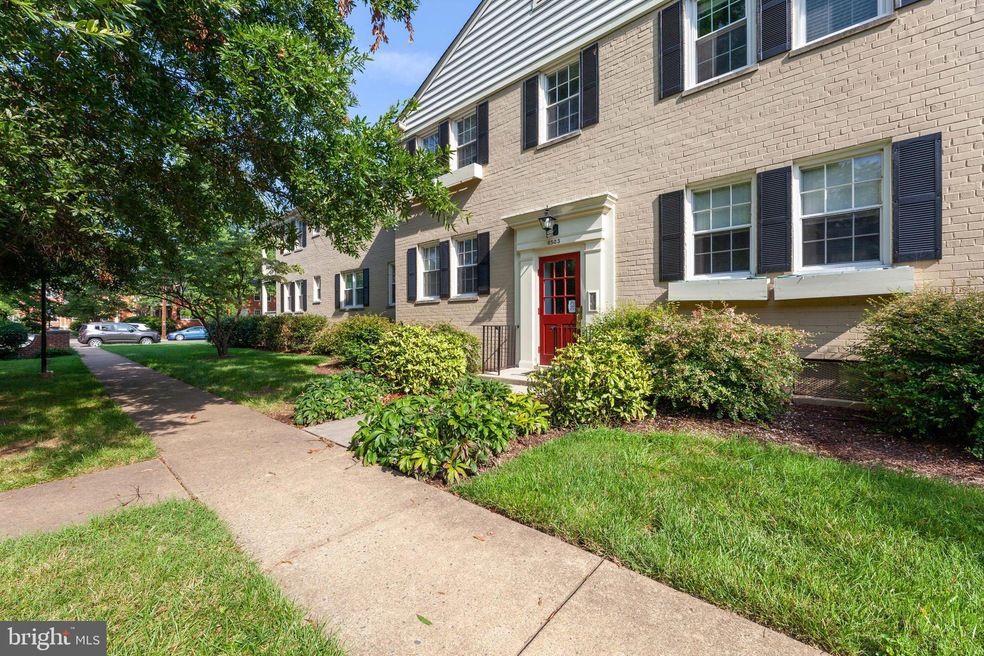
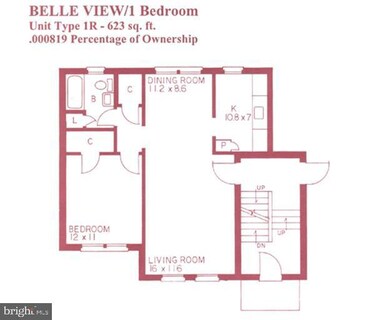
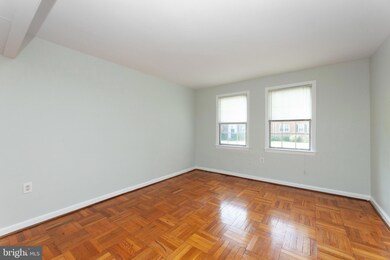
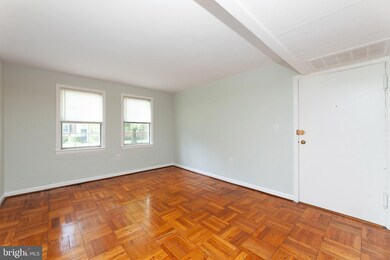
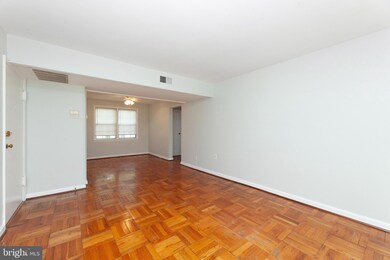
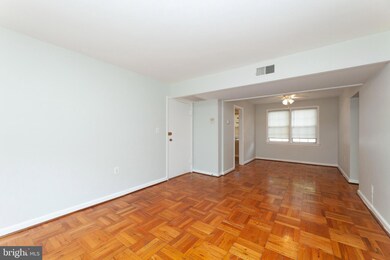
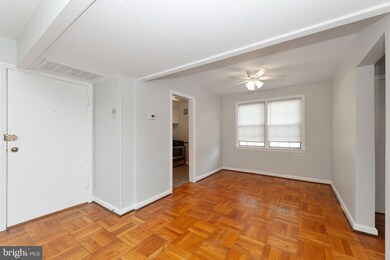
Welcome to Stately & Serene Belle View * This Condo Features Wood Floors, Stainless Appliances, Generous Closet Space * Extra Storage Unit Included * Laundry Located in Same Building * Ample Parking * Enjoy Belle View Amenities Including Outdoor Pool, Beautifully Manicured Grounds, Basketball and Tennis Courts, Tot Lot, Picnic Area * Two Blocks to Belle View Shopping Center with Safeway, Primo's Restaurant, Baskin Robbins/Dunkin Donuts & More * Short Distance to Old Town, Belle Haven Marina, Mount Vernon * Easy Access to GW Parkway, Mt Vernon Bike Trail & Fort Belvoir * Small Pets Case-by-Case * Available Immediately * $40 Application Fee
Last Agent to Rent the Property
(202) 431-9867 morgan@knull.com RE/MAX Gateway, LLC License #576602 Listed on: 10/07/2024
Last Renter's Agent
(703) 244-4024 pete@crouchrealtygroup.com Corcoran McEnearney License #0225195325
| Date | Buyer | Sale Price | Title Company |
|---|---|---|---|
| Clark William C | $169,900 | -- | |
| Macdonald Craig D | $85,000 | -- |
| Date | Status | Borrower | Loan Amount |
|---|---|---|---|
| Open | Clark William C | $135,920 | |
| Previous Owner | Macdonald Craig D | $86,700 |
| Date | Event | Price | List to Sale | Price per Sq Ft | Prior Sale |
|---|---|---|---|---|---|
| 10/11/2024 10/11/24 | Rented | $1,675 | 0.0% | -- | |
| 10/11/2024 10/11/24 | Off Market | $1,675 | -- | -- | |
| 10/07/2024 10/07/24 | For Rent | $1,675 | +21.8% | -- | |
| 09/17/2021 09/17/21 | Rented | $1,375 | 0.0% | -- | |
| 09/10/2021 09/10/21 | Under Contract | -- | -- | -- | |
| 08/26/2021 08/26/21 | For Rent | $1,375 | +14.6% | -- | |
| 12/20/2014 12/20/14 | Rented | $1,200 | -7.7% | -- | |
| 12/19/2014 12/19/14 | Under Contract | -- | -- | -- | |
| 10/03/2014 10/03/14 | For Rent | $1,300 | 0.0% | -- | |
| 09/18/2014 09/18/14 | Sold | $169,900 | 0.0% | $273 / Sq Ft | View Prior Sale |
| 08/28/2014 08/28/14 | Pending | -- | -- | -- | |
| 08/24/2014 08/24/14 | Price Changed | $169,900 | -2.9% | $273 / Sq Ft | |
| 08/04/2014 08/04/14 | For Sale | $175,000 | 0.0% | $281 / Sq Ft | |
| 08/17/2013 08/17/13 | Rented | $1,175 | 0.0% | -- | |
| 08/14/2013 08/14/13 | Under Contract | -- | -- | -- | |
| 07/20/2013 07/20/13 | For Rent | $1,175 | -6.0% | -- | |
| 06/25/2012 06/25/12 | Rented | $1,250 | 0.0% | -- | |
| 06/18/2012 06/18/12 | Under Contract | -- | -- | -- | |
| 06/07/2012 06/07/12 | For Rent | $1,250 | -- | -- |
| Year | Tax Paid | Tax Assessment Tax Assessment Total Assessment is a certain percentage of the fair market value that is determined by local assessors to be the total taxable value of land and additions on the property. | Land | Improvement |
|---|---|---|---|---|
| 2025 | $2,673 | $249,200 | $50,000 | $199,200 |
| 2024 | $2,673 | $230,740 | $46,000 | $184,740 |
| 2023 | $2,480 | $219,750 | $44,000 | $175,750 |
| 2022 | $2,440 | $213,350 | $43,000 | $170,350 |
| 2021 | $2,529 | $215,500 | $43,000 | $172,500 |
| 2020 | $2,319 | $195,910 | $39,000 | $156,910 |
| 2019 | $2,271 | $191,850 | $39,000 | $152,850 |
| 2018 | $1,882 | $163,640 | $33,000 | $130,640 |
| 2017 | $1,943 | $167,330 | $33,000 | $134,330 |
| 2016 | $1,998 | $172,480 | $34,000 | $138,480 |
| 2015 | $1,887 | $169,100 | $34,000 | $135,100 |
| 2014 | -- | $190,000 | $38,000 | $152,000 |
Landlord's Agent in 2024
Morgan Knull
RE/MAX Gateway, LLC
(202) 431-9867
4 in this area
171 Total Sales
Tenant's Agent in 2024
Peter Crouch
McEnearney Associates
(703) 244-4024
3 in this area
84 Total Sales
D
Seller Co-Listing Agent in 2021
Daniel Meadors
RE/MAX Gateway, LLC
d
Buyer's Agent in 2021
datacorrect BrightMLS
Non Subscribing Office
Seller's Agent in 2014
Carlos Pichardo
CAP Real Estate, LLC
(703) 928-8392
66 Total Sales
Seller's Agent in 2014
Ann Yanagihara
Compass
(703) 725-2346
41 Total Sales
Source: Bright MLS
MLS Number: VAFX2205426
APN: 0932-11-6503A2
Disclaimer: Certain information contained herein is derived from information provided by parties other than Homes.com. All information provided is deemed reliable, but is not guaranteed to be accurate and should be independently verified.
![]() The data relating to real estate for sale on this website appears in part through the BRIGHT Internet Data Exchange program, a voluntary cooperative exchange of property listing data between licensed real estate brokerage firms, and is provided by BRIGHT through a licensing agreement.
The data relating to real estate for sale on this website appears in part through the BRIGHT Internet Data Exchange program, a voluntary cooperative exchange of property listing data between licensed real estate brokerage firms, and is provided by BRIGHT through a licensing agreement.
Listing information is from various brokers who participate in the Bright MLS IDX program and not all listings may be visible on the site.
The property information being provided on or through the website is for the personal, non-commercial use of consumers and such information may not be used for any purpose other than to identify prospective properties consumers may be interested in purchasing.
Some properties which appear for sale on the website may no longer be available because they are for instance, under contract, sold or are no longer being offered for sale.
Property information displayed is deemed reliable but is not guaranteed.
Copyright 2025 Bright MLS, Inc.