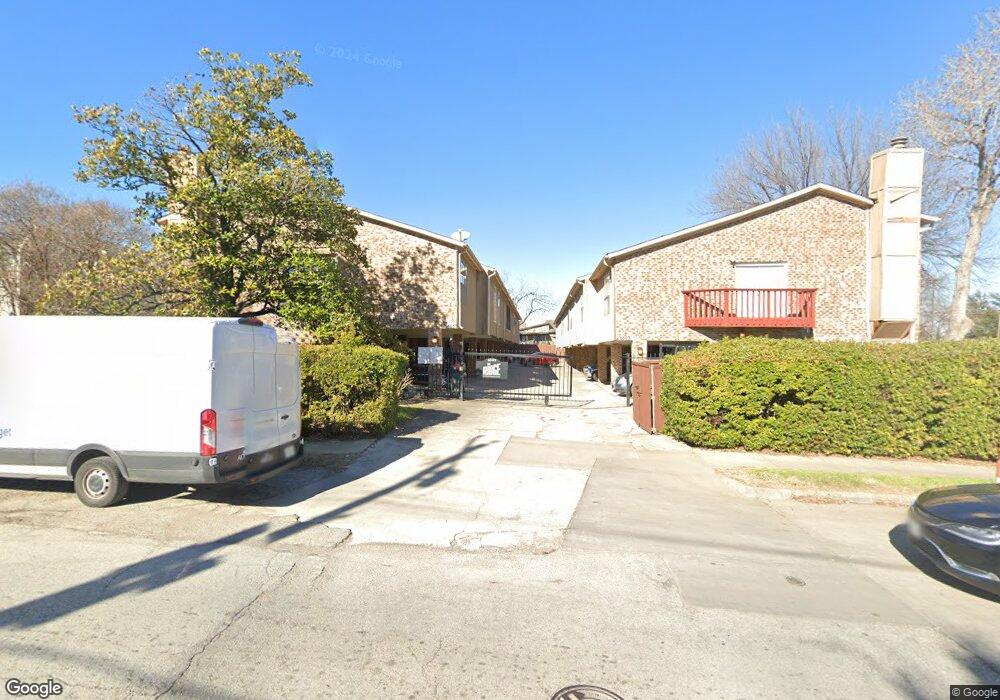
6503 Ridgecrest Rd Unit 116 Dallas, TX 75231
Vickery NeighborhoodEstimated Value: $156,198 - $172,000
2
Beds
2
Baths
1,001
Sq Ft
$164/Sq Ft
Est. Value
About This Home
This home is located at 6503 Ridgecrest Rd Unit 116, Dallas, TX 75231 and is currently estimated at $163,800, approximately $163 per square foot. 6503 Ridgecrest Rd Unit 116 is a home located in Dallas County with nearby schools including Geneva Heights Elementary, Sam Tasby Middle School, and Emmett J Conrad High School.
Ownership History
Date
Name
Owned For
Owner Type
Purchase Details
Closed on
Nov 14, 2016
Sold by
Martinez Juan Manuel
Bought by
Foster John
Current Estimated Value
Home Financials for this Owner
Home Financials are based on the most recent Mortgage that was taken out on this home.
Original Mortgage
$62,000
Outstanding Balance
$52,765
Interest Rate
5.5%
Mortgage Type
Adjustable Rate Mortgage/ARM
Estimated Equity
$111,035
Purchase Details
Closed on
Aug 31, 2015
Sold by
Gary Kim
Bought by
Martinez Juan Manuel
Purchase Details
Closed on
Dec 8, 2004
Sold by
Pledged Property Ii Llc
Bought by
Gary Kim
Purchase Details
Closed on
Aug 27, 1999
Sold by
Pinkerton Mark A
Bought by
Franklin Brenda
Home Financials for this Owner
Home Financials are based on the most recent Mortgage that was taken out on this home.
Original Mortgage
$31,500
Interest Rate
12.12%
Create a Home Valuation Report for This Property
The Home Valuation Report is an in-depth analysis detailing your home's value as well as a comparison with similar homes in the area
Home Values in the Area
Average Home Value in this Area
Purchase History
| Date | Buyer | Sale Price | Title Company |
|---|---|---|---|
| Foster John | -- | None Available | |
| Martinez Juan Manuel | -- | Fti | |
| Gary Kim | -- | -- | |
| Franklin Brenda | -- | -- |
Source: Public Records
Mortgage History
| Date | Status | Borrower | Loan Amount |
|---|---|---|---|
| Open | Foster John | $62,000 | |
| Previous Owner | Franklin Brenda | $31,500 | |
| Closed | Franklin Brenda | $10,500 |
Source: Public Records
Tax History Compared to Growth
Tax History
| Year | Tax Paid | Tax Assessment Tax Assessment Total Assessment is a certain percentage of the fair market value that is determined by local assessors to be the total taxable value of land and additions on the property. | Land | Improvement |
|---|---|---|---|---|
| 2025 | $161 | $178,740 | $20,450 | $158,290 |
| 2024 | $161 | $160,840 | $20,450 | $140,390 |
| 2023 | $161 | $160,840 | $20,450 | $140,390 |
| 2022 | $1,577 | $63,060 | $20,450 | $42,610 |
| 2021 | $1,664 | $63,060 | $20,450 | $42,610 |
| 2020 | $1,711 | $63,060 | $20,450 | $42,610 |
| 2019 | $2,107 | $74,070 | $16,360 | $57,710 |
| 2018 | $2,014 | $74,070 | $16,360 | $57,710 |
| 2017 | $2,014 | $74,070 | $6,820 | $67,250 |
| 2016 | $694 | $25,530 | $6,820 | $18,710 |
| 2015 | $708 | $25,530 | $6,820 | $18,710 |
| 2014 | $708 | $24,920 | $6,820 | $18,100 |
Source: Public Records
Map
Nearby Homes
- 6738 Eastridge Dr Unit 104B
- 6808 Eastridge Dr Unit E1 Apt 24
- 6620 Eastridge Dr Unit 219
- 8750 Park Ln Unit 147
- 8750 Park Ln Unit 151
- 8601 Park Ln Unit 735G
- 8601 Park Ln Unit 624
- 8601 Park Ln Unit 221B
- 8601 Park Ln Unit 721G
- 8601 Park Ln Unit 121A
- 8601 Park Ln Unit 726G
- 8601 Park Ln Unit 523E
- 8601 Park Ln Unit 414
- 8601 Park Ln Unit 312C
- 8601 Park Ln Unit 323C
- 8601 Park Ln Unit 111A
- 8560 Park Ln Unit 29
- 6122 Ridgecrest Rd Unit 2007
- 6119 Summer Creek Cir
- 6019 Ridgecrest Rd Unit 201
- 6503 Ridgecrest Rd Unit 106
- 6503 Ridgecrest Rd Unit 107
- 6503 Ridgecrest Rd Unit 116
- 6503 Ridgecrest Rd Unit 115
- 6503 Ridgecrest Rd Unit 114
- 6503 Ridgecrest Rd Unit 113
- 6503 Ridgecrest Rd Unit 112
- 6503 Ridgecrest Rd Unit 111
- 6503 Ridgecrest Rd Unit 110
- 6503 Ridgecrest Rd Unit 109
- 6503 Ridgecrest Rd Unit 108
- 6503 Ridgecrest Rd Unit 105
- 6503 Ridgecrest Rd Unit 104
- 6503 Ridgecrest Rd Unit 103
- 6503 Ridgecrest Rd Unit 102
- 6503 Ridgecrest Rd Unit 101
- 6503 Ridgecrest Rd Unit 114
- 6503 Ridgecrest Rd Unit 103-C
- 6503 Ridgecrest Rd Unit 109
- 6503 Ridgecrest Rd Unit H-108