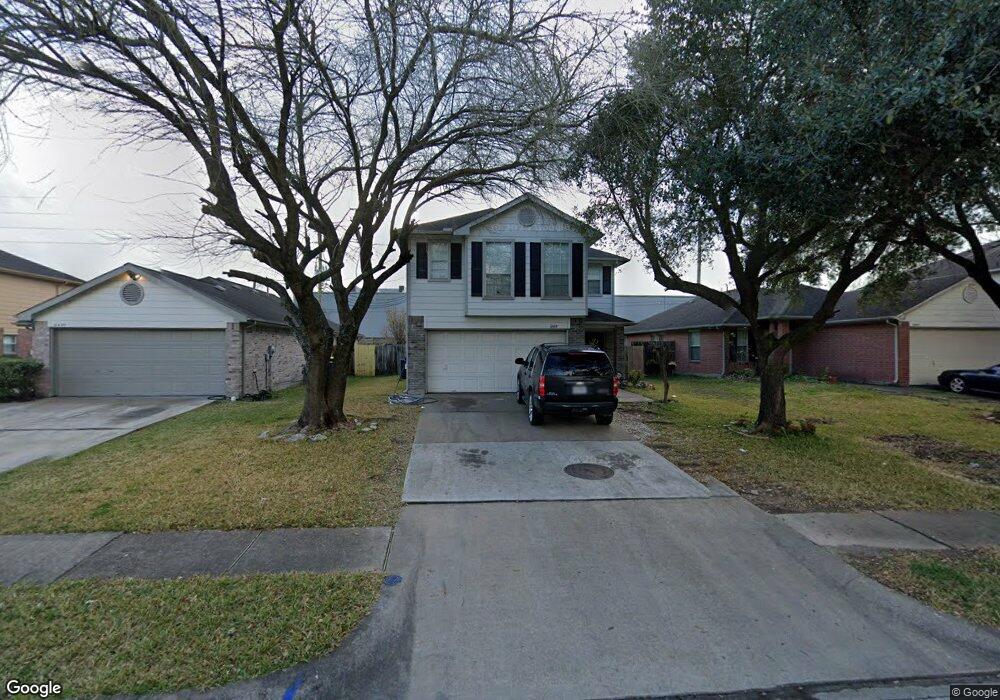
6503 Sutton Meadows Dr Houston, TX 77086
North Houston NeighborhoodEstimated Value: $237,000 - $265,000
4
Beds
3
Baths
1,928
Sq Ft
$132/Sq Ft
Est. Value
About This Home
This home is located at 6503 Sutton Meadows Dr, Houston, TX 77086 and is currently estimated at $254,169, approximately $131 per square foot. 6503 Sutton Meadows Dr is a home located in Harris County with nearby schools including Kujawa EC/Pre-K/K School, Wilson Intermediate School, and Shotwell Middle School.
Ownership History
Date
Name
Owned For
Owner Type
Purchase Details
Closed on
Jul 21, 2016
Sold by
One Pine Viii Llc
Bought by
Osorio Martinez Jaime and Lopez Guzman Monica B
Current Estimated Value
Home Financials for this Owner
Home Financials are based on the most recent Mortgage that was taken out on this home.
Original Mortgage
$112,500
Outstanding Balance
$89,867
Interest Rate
3.6%
Mortgage Type
New Conventional
Estimated Equity
$164,302
Purchase Details
Closed on
Sep 10, 2015
Sold by
Vivar Saul and Vivar Micailina
Bought by
One Pine Viii Llc
Purchase Details
Closed on
Jun 30, 2000
Sold by
Kaufman & Broad Lone Star Lp
Bought by
Vivar Micailina and Vivar Saul
Home Financials for this Owner
Home Financials are based on the most recent Mortgage that was taken out on this home.
Original Mortgage
$90,873
Interest Rate
8.56%
Mortgage Type
FHA
Create a Home Valuation Report for This Property
The Home Valuation Report is an in-depth analysis detailing your home's value as well as a comparison with similar homes in the area
Home Values in the Area
Average Home Value in this Area
Purchase History
| Date | Buyer | Sale Price | Title Company |
|---|---|---|---|
| Osorio Martinez Jaime | -- | None Available | |
| One Pine Viii Llc | $100,000 | None Available | |
| Vivar Micailina | -- | -- |
Source: Public Records
Mortgage History
| Date | Status | Borrower | Loan Amount |
|---|---|---|---|
| Open | Osorio Martinez Jaime | $112,500 | |
| Previous Owner | Vivar Micailina | $90,873 |
Source: Public Records
Tax History Compared to Growth
Tax History
| Year | Tax Paid | Tax Assessment Tax Assessment Total Assessment is a certain percentage of the fair market value that is determined by local assessors to be the total taxable value of land and additions on the property. | Land | Improvement |
|---|---|---|---|---|
| 2025 | $5,866 | $247,139 | $35,750 | $211,389 |
| 2024 | $5,866 | $253,645 | $35,750 | $217,895 |
| 2023 | $5,866 | $253,645 | $36,693 | $216,952 |
| 2022 | $5,566 | $228,642 | $28,225 | $200,417 |
| 2021 | $4,489 | $184,876 | $28,225 | $156,651 |
| 2020 | $4,922 | $182,331 | $28,225 | $154,106 |
| 2019 | $4,339 | $154,601 | $19,476 | $135,125 |
| 2018 | $2,009 | $139,924 | $19,476 | $120,448 |
| 2017 | $3,569 | $131,864 | $17,500 | $114,364 |
| 2016 | $3,437 | $126,995 | $17,500 | $109,495 |
| 2015 | $2,122 | $110,221 | $17,500 | $92,721 |
| 2014 | $2,122 | $94,824 | $17,500 | $77,324 |
Source: Public Records
Map
Nearby Homes
- 6411 Halstead Meadows Cir
- 6622 Sutton Meadows Dr
- 10730 Antoine Dr
- 0 Tomball Pkwy
- 6706 Redding Springs Ln
- 12610 Twilight Bend Ct
- 5914 Stirring Winds Ln
- 7011 Lower Arrow Dr
- 6703 Deer Ridge Ln
- 00 Romona Blvd
- 6830 Desert Rose Ln
- 10214 Trade Winds Dr
- 9815 Lonsford Dr
- 6606 Dusty Dawn Dr
- 6822 Dusty Dawn Dr
- 10306 Jillana Kaye Dr
- 3265 Frick Rd
- 12623 Ann Louise Rd
- 00 Essie Rd
- 6911 Silver Star Dr
- 6427 Sutton Meadows Dr
- 6507 Sutton Meadows Dr
- 6423 Sutton Meadows Dr
- 6511 Sutton Meadows Dr
- 6419 Sutton Meadows Dr
- 6515 Sutton Meadows Dr
- 6543 Duckett Park Dr
- 6519 Sutton Meadows Dr
- 6415 Sutton Meadows Dr
- 6510 Sutton Meadows Dr
- 6514 Sutton Meadows Dr
- 6539 Duckett Park Dr
- 9703 Sutton Meadows Ct
- 6411 Sutton Meadows Dr
- 6523 Sutton Meadows Dr
- 6518 Sutton Meadows Dr
- 9707 Sutton Meadows Ct
- 6535 Duckett Park Dr
- 6527 Sutton Meadows Dr
- 6407 Sutton Meadows Dr