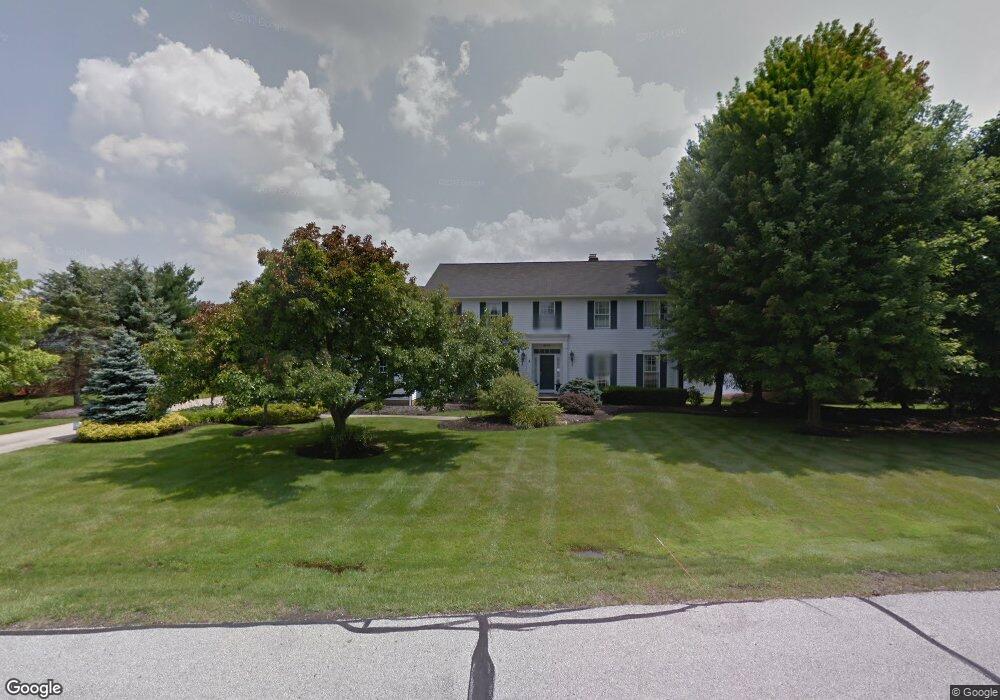
6505 Dunbarton Dr Hudson, OH 44236
Estimated Value: $831,000 - $1,176,000
4
Beds
5
Baths
4,122
Sq Ft
$230/Sq Ft
Est. Value
About This Home
This home is located at 6505 Dunbarton Dr, Hudson, OH 44236 and is currently estimated at $947,174, approximately $229 per square foot. 6505 Dunbarton Dr is a home located in Summit County with nearby schools including Ellsworth Hill Elementary School, East Woods Intermediate School, and Hudson Middle School.
Ownership History
Date
Name
Owned For
Owner Type
Purchase Details
Closed on
Jul 28, 2006
Sold by
Vankirk Albert C and Van Kirk Sandra V
Bought by
Buchanan Jennifer L
Current Estimated Value
Home Financials for this Owner
Home Financials are based on the most recent Mortgage that was taken out on this home.
Original Mortgage
$275,000
Outstanding Balance
$164,836
Interest Rate
6.73%
Mortgage Type
Purchase Money Mortgage
Estimated Equity
$782,338
Purchase Details
Closed on
Nov 8, 1999
Sold by
Mecca Williams James Lewis Anna
Bought by
Vankirk Albert C and Vankirk Sandra
Home Financials for this Owner
Home Financials are based on the most recent Mortgage that was taken out on this home.
Original Mortgage
$499,100
Interest Rate
7%
Create a Home Valuation Report for This Property
The Home Valuation Report is an in-depth analysis detailing your home's value as well as a comparison with similar homes in the area
Home Values in the Area
Average Home Value in this Area
Purchase History
| Date | Buyer | Sale Price | Title Company |
|---|---|---|---|
| Buchanan Jennifer L | $680,000 | Revere Title Summit County | |
| Vankirk Albert C | $625,000 | Midland Commerce Group |
Source: Public Records
Mortgage History
| Date | Status | Borrower | Loan Amount |
|---|---|---|---|
| Open | Buchanan Jennifer L | $275,000 | |
| Previous Owner | Vankirk Albert C | $499,100 |
Source: Public Records
Tax History
| Year | Tax Paid | Tax Assessment Tax Assessment Total Assessment is a certain percentage of the fair market value that is determined by local assessors to be the total taxable value of land and additions on the property. | Land | Improvement |
|---|---|---|---|---|
| 2024 | $12,716 | $245,130 | $59,861 | $185,269 |
| 2023 | $12,716 | $245,130 | $59,861 | $185,269 |
| 2022 | $10,916 | $187,247 | $45,696 | $141,551 |
| 2021 | $10,908 | $187,247 | $45,696 | $141,551 |
| 2020 | $10,703 | $187,250 | $45,700 | $141,550 |
| 2019 | $12,506 | $203,120 | $43,410 | $159,710 |
| 2018 | $12,479 | $203,120 | $43,410 | $159,710 |
| 2017 | $11,922 | $203,120 | $43,410 | $159,710 |
| 2016 | $12,007 | $191,630 | $43,410 | $148,220 |
| 2015 | $11,922 | $191,630 | $43,410 | $148,220 |
| 2014 | $11,956 | $191,630 | $43,410 | $148,220 |
| 2013 | $11,820 | $185,010 | $43,410 | $141,600 |
Source: Public Records
Map
Nearby Homes
- 2365 Ebury Ln
- 6598 Meadow Farm Dr
- 6740 Pinebrooke Dr
- 338 Simon Rd
- 2353 W Hale Dr
- 154 State Route 303
- 213 E Streetsboro St
- 42 Fox Trace Ln
- 171 Ravenna St
- 179 Elm St
- 2308 Glenn Echo Dr
- 5866 Ogilby Dr
- 5974 Anna Lee Dr
- 2795 Stonebridge Ct
- 43 N Oviatt St
- 12 N Oviatt St
- 128 Hudson St
- 9005 Sandpiper Dr
- 9085 Sandpiper Dr
- 2297 Olde Farm Ln
- 6519 Dunbarton Dr
- 6485 Dunbarton Dr
- 6500 Dunbarton Dr
- 6475 Dunbarton Dr
- 6488 Dunbarton Dr
- 6514 Dunbarton Dr
- 6529 Dunbarton Dr
- 6524 Dunbarton Dr
- 6465 Dunbarton Dr
- 6257 Canterbury Dr
- 6536 Dunbarton Dr
- 6242 Canterbury Dr
- 6530 Blackfriars Ln
- 6541 Dunbarton Dr
- 6524 Blackfriars Ln
- 6462 Hammontree Dr
- 6271 Canterbury Dr
- 6548 Dunbarton Dr
- 6516 Blackfriars Ln
- 6534 Thornbrook Cir
Your Personal Tour Guide
Ask me questions while you tour the home.